


The evolution of gold prices is one of the most significant narratives in the global economy.
It is not just a record of numbers; it is a timeline of wars, recessions, pandemics, and human resilience.
For investors and families alike, the gold price chart serves as a financial history book, showing how the "yellow metal" has consistently defeated inflation over the last century.
If you are tracking the gold price trend or wondering if this is the right time to invest, this guide covers everything from A Brief History of Gold to the hidden taxes that affect the gold rate today.
Gold Rates Historical Data & Trend for India
Below is the 24k gold price historical data for each year with growth % from last year starting from 1950 to 2026 (as of 8 Jan).
| Year | Price (₹ per 10g) | Growth (%) |
| Gold Price in 1950 | ₹99.00 | - |
| Gold Price in 1964 | ₹63.25 | -36.11% |
| Gold Price in 1970 | ₹184 | 190.91% |
| Gold Price in 1975 | ₹540 | 193.48% |
| Gold Price in 1980 | ₹1,330 | 146.30% |
| Gold Price in 1985 | ₹2,130 | 60.15% |
| Gold Price in 1990 | ₹3,200 | 50.23% |
| Gold Price in 1995 | ₹4,680 | 46.25% |
| Gold Price in 2000 | ₹4,400 | -5.98% |
| Gold Price in 2005 | ₹7,000 | 59.09% |
| Gold Price in 2007 | ₹10,800 | 54.29% |
| Gold Price in 2008 | ₹12,500 | 15.74% |
| Gold Price in 2009 | ₹14,500 | 16.00% |
| Gold Price in 2010 | ₹18,500 | 27.59% |
| Gold Price in 2011 | ₹26,400 | 42.70% |
| Gold Price in 2012 | ₹31,050 | 17.61% |
| Gold Price in 2013 | ₹29,600 | -4.67% |
| Gold Price in 2014 | ₹28,006 | -5.39% |
| Gold Price in 2015 | ₹26,343 | -5.94% |
| Gold Price in 2016 | ₹28,623 | 8.66% |
| Gold Price in 2017 | ₹29,667 | 3.65% |
| Gold Price in 2018 | ₹31,438 | 5.97% |
| Gold Price in 2019 | ₹35,220 | 12.03% |
| Gold Price in 2020 | ₹48,651 | 38.13% |
| Gold Price in 2021 | ₹48,720 | 0.14% |
| Gold Price in 2022 | ₹52,670 | 8.11% |
| Gold Price in 2023 | ₹65,330 | 24.04% |
| Gold Price in 2024 | ₹77,913 | 19.26% |
| Gold Price in 2025 | ₹139,910 | 79.50% |
To know the current price of Gold, please visit Gold Rates in India.
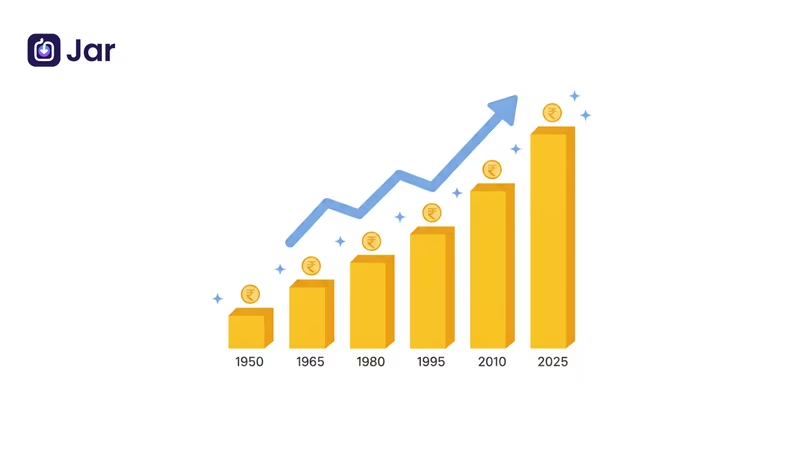
How have gold prices moved in India since the 1950s?
Gold Price History Chart
Price per 10g in Indian Rupees (₹)
You have seen the history. You have seen how ₹63 in 1964 turned into ₹1,27,200 in 2025. The lesson from the gold price chart is clear: waiting usually means paying a higher price later.
Many people think they need thousands of rupees to buy gold, but that is no longer true.
Start Buying Digital Gold with Jar You don't need to wait for a wedding or a bonus to start Buying. With Jar, you can automatically save small amounts, even your spare change and convert it into 24 Carat Digital Gold instantly.
Decade Wise Gold Price History (1950 – 2026)
The following table breaks down the gold price volatility and growth by decade. It highlights the lowest, highest, and average prices of 10 grams of 24K gold during each era.
| Decade | Opening Price | Lowest Price | Highest Price | Average Price | Decadal Return (%) |
| Gold price in the 1950s | ₹99 | ₹73 | ₹102 | ₹88 | NA |
| Gold price in the 1960s | ₹111 | ₹63 | ₹176 | ₹111 | 12% |
| Gold price in the 1970s | ₹184 | ₹184 | ₹937 | ₹444 | 66% |
| Gold price in the 1980s | ₹1,330 | ₹1,330 | ₹3,140 | ₹2,166 | 623% |
| Gold price in the 1990s | ₹3,200 | ₹3,200 | ₹5,160 | ₹4,258 | 141% |
| Gold price in the 2000s | ₹4,400 | ₹4,300 | ₹15,417 | ₹7,775 | 38% |
| Gold price in the 2010s | ₹18,448 | ₹18,448 | ₹35,154 | ₹28,088 | 319% |
| Gold price in the 2020s | ₹47,562 | ₹47,437 | ₹1,33,195 | ₹90,316 | 280% |
Key Historical Insights:
- The 1980s Explosion (623% Growth): This massive jump reflects the global inflation crisis of the 1970s, where gold prices rallied from ₹184 to over ₹1,300.
- The 2010s Surge (319% Growth): Following the 2008 Financial Crisis, investors flocked to gold, driving the opening price of the 2010s to ₹18,448—a 3x jump from the previous decade.
- The 2020s Highs: With a peak of ₹1,33,195, the current decade is defined by post-pandemic inflation and central bank buying, cementing gold's status as a hedge against economic uncertainty.
Gold Investment Returns: The Power of Compounding (CAGR)
Many investors ask, "Does gold beat inflation?" The data from the last 20 years answers with a resounding yes.
While Fixed Deposits (FDs) have averaged 6-7% and inflation has hovered around 5-6%, gold has delivered double-digit growth over long horizons.
Gold Compounded Annual Growth Rate (CAGR) – 2026 Update
| Time Period | CAGR (Annual Return) | Absolute Return |
| 5 Years (2021-2026) | 23.10% | 183% |
| 10 Years (2016-2026) | 18.50% | 446% |
| 15 Years (2011-2026) | 12.00% | 450% |
| 20 Years (2006-2026) | 14.80% | 1500% |
6 Factors That Determine Gold Prices in India
Why did gold touch ₹1.45 Lakh in 2026? It wasn't just "weddings." These are the six mechanical levers that move the price:
1. Import Duty (The Government's Lever) India imports nearly all its gold. When the government changes the import tax, prices shift instantly.
- Recent Impact: The effective import duty was slashed to ~6% (down from 15% in 2024), which helped stabilize domestic premiums despite rising global prices.
2. The "Fear Trade" (Geopolitics) Gold loves bad news. Prices surged in 2022 (Ukraine) and 2025 (Global Tensions).
- Rule of Thumb: If the news headlines are scary (war, pandemic, recession), gold prices go UP.
3. Rupee vs. Dollar Gold is bought internationally in Dollars ($). If the Indian Rupee (₹) weakens against the Dollar, gold becomes more expensive in India, even if international prices stay flat.
4. Central Bank Buying The Reserve Bank of India (RBI) and the People's Bank of China have been aggressively buying gold to reduce reliance on the US Dollar.
- Stat: Massive central bank buying in 2024-25 created a "price floor," preventing gold from crashing.
5. US Fed Interest Rates There is an inverse relationship.
- High Rates: Investors prefer US Bonds; Gold falls.
- Low Rates: Bonds pay less; Investors flock to Gold. (The 2025-26 rally was partly driven by expected rate cuts).
6. Monsoon & Rural Demand 60% of India's gold demand comes from rural areas. A good monsoon means good harvest profits, which farmers historically park in gold.
A Brief History of Gold: Who Discovered It?
Before diving into the rates, we must answer a fundamental question: who discovered gold and which year?
Unlike modern currency, gold was never "invented." It was discovered by early humans, likely in its natural, glittering state in riverbeds.
- When did gold was discovered? The earliest evidence of gold processing dates back to 4,600 BC at the Varna Necropolis in Bulgaria.
- The First Money: While no single person can claim the discovery, the Kingdom of Lydia (modern-day Turkey) is credited with striking the first gold coins around 600 BC, officially birthing the concept of the gold price.
Why Is Gold So Precious?
Have you ever asked yourself, why is gold so precious? It isn’t just because it looks good in a wedding necklace.
- Indestructibility: Gold is chemically inert. It does not rust or tarnish. A coin from 1950 looks the same today.
- Scarcity: It is rare enough to be valuable but available enough to trade.
- The "Fear" Factor: When stock markets crash or governments print too much money, investors rush to gold, driving up the gold rate.
Why the Gold Rate is Increasing
You might notice that the gold rate today is significantly higher than it was just a few years ago. Why does the gold price trend keep pointing up?
1. The "Safe Haven" Effect
Whenever there is bad news in the world war, pandemics, or political instability investors sell risky stocks and buy gold. This sudden demand spikes the gold rate.
2. Currency Fluctuation
In India, gold is imported using US dollars. When the rupee weakens against the dollar, the gold price in India rises, even if the international market is stable.
3. Marriage Season & Demand
In India, the 22 carat gold rate today is often driven by local demand. During wedding seasons (Diwali, Akshaya Tritiya), millions of families buying jewelry can push the 22kt gold rate higher than the global average.
Understanding Purity: 24k vs 22k
When checking the gold price today, it is critical to know which "karat" you are looking at, as the price difference is massive.
24 Carat Gold Price (The Investment Standard)
This is 99.9% pure gold. It is soft and malleable. If you see the 24 k gold rate today reaching record highs, this refers to gold bars and coins. It is not for jewelry.
22 Carat Gold Rate (The Jewelry Standard)
This is 91.6% gold mixed with metals like copper, zinc, or silver to make it hard enough to wear. The 22 kt gold rate today will always be lower than 24k.
(Tip: This is often referred to as "916 Gold" in shops).
1 Gram Gold Price
Many investors now buy gold in small quantities. Tracking the 1 gram gold price is the best way to start a Systematic Investment Plan (SIP) in gold.
The Hidden Costs: GST and Making Charges Of Gold
Many buyers look at the gold rate graph online and are surprised when the final bill at the jeweler is higher. This is due to two factors that most blogs don't mention.
Making Charges
This is the fee for the labor involved in designing the jewelry. It can range from 8% to 25% depending on the intricacy of the design.
GST (Goods and Services Tax):
- 3% GST is applied to the value of the gold.
- 5% GST is applied to the making charges.
Example: If the gold price last 10 days averaged ₹70,000, your final bill for 10 g of jewelry could easily be ₹80,000+ after adding these costs.
Learn more about GST on Gold in detail here.
Beyond Gold: The Silver (Chandi) Connection
Smart investors don't just watch gold. The chandi rate today (Silver) is often more volatile but can offer higher percentage returns.
Silver is heavily used in EV batteries and solar panels, meaning its price is driven by industrial demand, unlike gold which is driven by investment demand.
Quickly estimate the value of your gold with an easy, accurate calculator that helps you make smarter buying or selling decisions.
Future Prediction: Where Is Gold Heading?
Looking at the gold price for the last 10 days might show short-term volatility, but the long-term gold price trend is clear.
With 2025 prices touching ₹1,27,200, financial experts predict that as long as global inflation remains high, gold will continue to protect wealth.
Whether you are tracking the 24 carat gold rate today for a digital gold investment or the 22kt gold rate for a family wedding, history tells us one thing: Paper currency loses value over time, but gold preserves it.
FAQs
What was the gold price in India in 2014?
In 2014, the price of gold in India was ₹28,006 per 10 grams, marking a decline of -5.39% compared to the previous year. After the rapid growth seen in the early 2010s, the market cooled down significantly. This correction allowed the market to consolidate, as government import restrictions and a stabilizing global economy reduced the immediate investment demand for the metal.
What was the gold price in India in 2016?
The gold price in India in 2016 stood at ₹28,623 per 10 grams, reflecting a growth of 8.66%. The market recovered from the slump of 2015, driven by global economic uncertainties such as Brexit and domestic events like demonetization. This year marked a return to positive territory for gold investors, establishing a base for future gains.
What was the gold price in India in 2010?
During 2010, gold prices in India surged to ₹18,500 per 10 grams, achieving a remarkable growth of 27.59%. This was a standout year for the bullion market, as the metal continued its strong post-recession rally. Investors flocked to gold as a hedge against inflation, driving prices up by nearly ₹4,000 from the previous year.
What was the gold price in India in 2005?
In 2005, the gold price was ₹7,000 per 10 grams, with a massive growth rate of 59.09%. This year was pivotal, as it marked the beginning of a major bull run in the Indian market. The sharp percentage increase signaled a shift in sentiment, transforming gold from a mere cultural asset into a high-performing investment vehicle for Indian households.
What was the gold price in India in 2018?
The price of gold in 2018 averaged ₹31,438 per 10 grams, showing a moderate growth of 5.97%. While not as volatile as previous years, the steady increase demonstrated gold's resilience. The weakening Rupee played a significant role in keeping domestic prices elevated, ensuring positive returns for those holding the asset.
What was the gold price in India in 2000?
In 2000, gold traded at ₹4,400 per 10 grams, which was a decrease of -5.98% from the previous year. This period represented a lull in the precious metals market, with prices correcting downwards. It was one of the last years of low prices before the commodity boom of the mid-2000s began to take shape.
What was the gold price in India in 2007?
The gold price in 2007 reached ₹10,800 per 10 grams, posting a significant growth of 54.29%. Crossing the ₹10,000 milestone was a psychological breakthrough for the Indian market. The looming global financial instability fueled demand, causing prices to skyrocket and rewarding early investors with substantial gains.
What was the gold price in India in 2008?
In 2008, despite the global financial crash, gold prices in India rose to ₹12,500 per 10 grams, a growth of 15.74%. While equity markets collapsed, gold held its ground as a safe haven. The depreciating currency further shielded domestic prices, ensuring that Indian gold owners saw their portfolio value increase during a time of economic distress.
What was the gold price in India in 2011?
The gold price in 2011 hit ₹26,400 per 10 grams, recording a robust growth of 42.70%. This year is often cited as the peak of that decade's bull market. The combination of the Eurozone debt crisis and US credit rating downgrade pushed investors aggressively into gold, resulting in one of the highest annual price jumps in history.
What was the gold price in India in 2009?
In 2009, the average gold price was ₹14,500 per 10 grams, reflecting a steady growth of 16.00%. Following the 2008 crisis, central banks worldwide injected liquidity into markets, which supported commodity prices. Gold continued its upward trajectory, bridging the gap between the crash of '08 and the highs of '10.
What was the gold price in India in 2012?
The gold price in 2012 climbed to ₹31,050 per 10 grams, showing a growth of 17.61%. The momentum from the previous year carried forward, keeping prices above the ₹30,000 mark. Persistent inflation and sustained demand from the jewelry sector kept the floor price high, even as the global rally began to lose some steam.
What was the gold price in India in 2017?
In 2017, gold traded at ₹29,667 per 10 grams, with a modest growth of 3.65%. The market stabilized following the implementation of GST, which brought structural changes to the industry. Prices remained range-bound but positive, serving as a year of accumulation for long-term investors.
What was the gold price in India in 2015?
The gold price in 2015 was ₹26,343 per 10 grams, a decline of -5.94%. This was a bearish year for gold, heavily influenced by the anticipation of interest rate hikes in the US. The strengthening dollar put pressure on global prices, leading to a rare year of negative returns for Indian gold buyers.
What was the gold price in India in 2020?
In 2020, the gold price surged to ₹48,651 per 10 grams, delivering a massive growth of 38.13%. The COVID-19 pandemic triggered a flight to safety, causing prices to spike to all-time highs. This year highlighted gold's critical role as crisis insurance, with the metal outperforming almost all other asset classes during the economic lockdown.
What was the gold price in India in 1995?
The gold price in 1995 was ₹4,680 per 10 grams, with a solid growth of 46.25%. The mid-90s saw a sharp appreciation in domestic gold prices, driven by currency factors and local demand. This year stands out for its high percentage return in a decade that was otherwise relatively quiet for global commodity markets.