



Key Highlights
- Gold edged out the Nifty 50 over 10 years in the late-2025 review, at about 16.9% against 13.7%.
- The Nifty 50 tends to lead when the economy is growing and company profits are rising.
- Gold tends to lead when inflation, currency weakness or global tension dominate headlines.
- Gold pays no interest or dividends, so all its return comes from price gains.
- Nifty returns come from company earnings, which compound over time.
- Gold had a rough stretch between 2013 and 2015, while the Nifty posted strong gains in 2014.
- Gold usually moves in smoother patterns, while the Nifty swings more often.
- Equity offers liquidity and growth, but it can drop sharply in the short term.
- Using both assets together can help smooth out the ride across market cycles.
- Index returns do not include dividends, so the full picture for equity is slightly better than the headline figures.
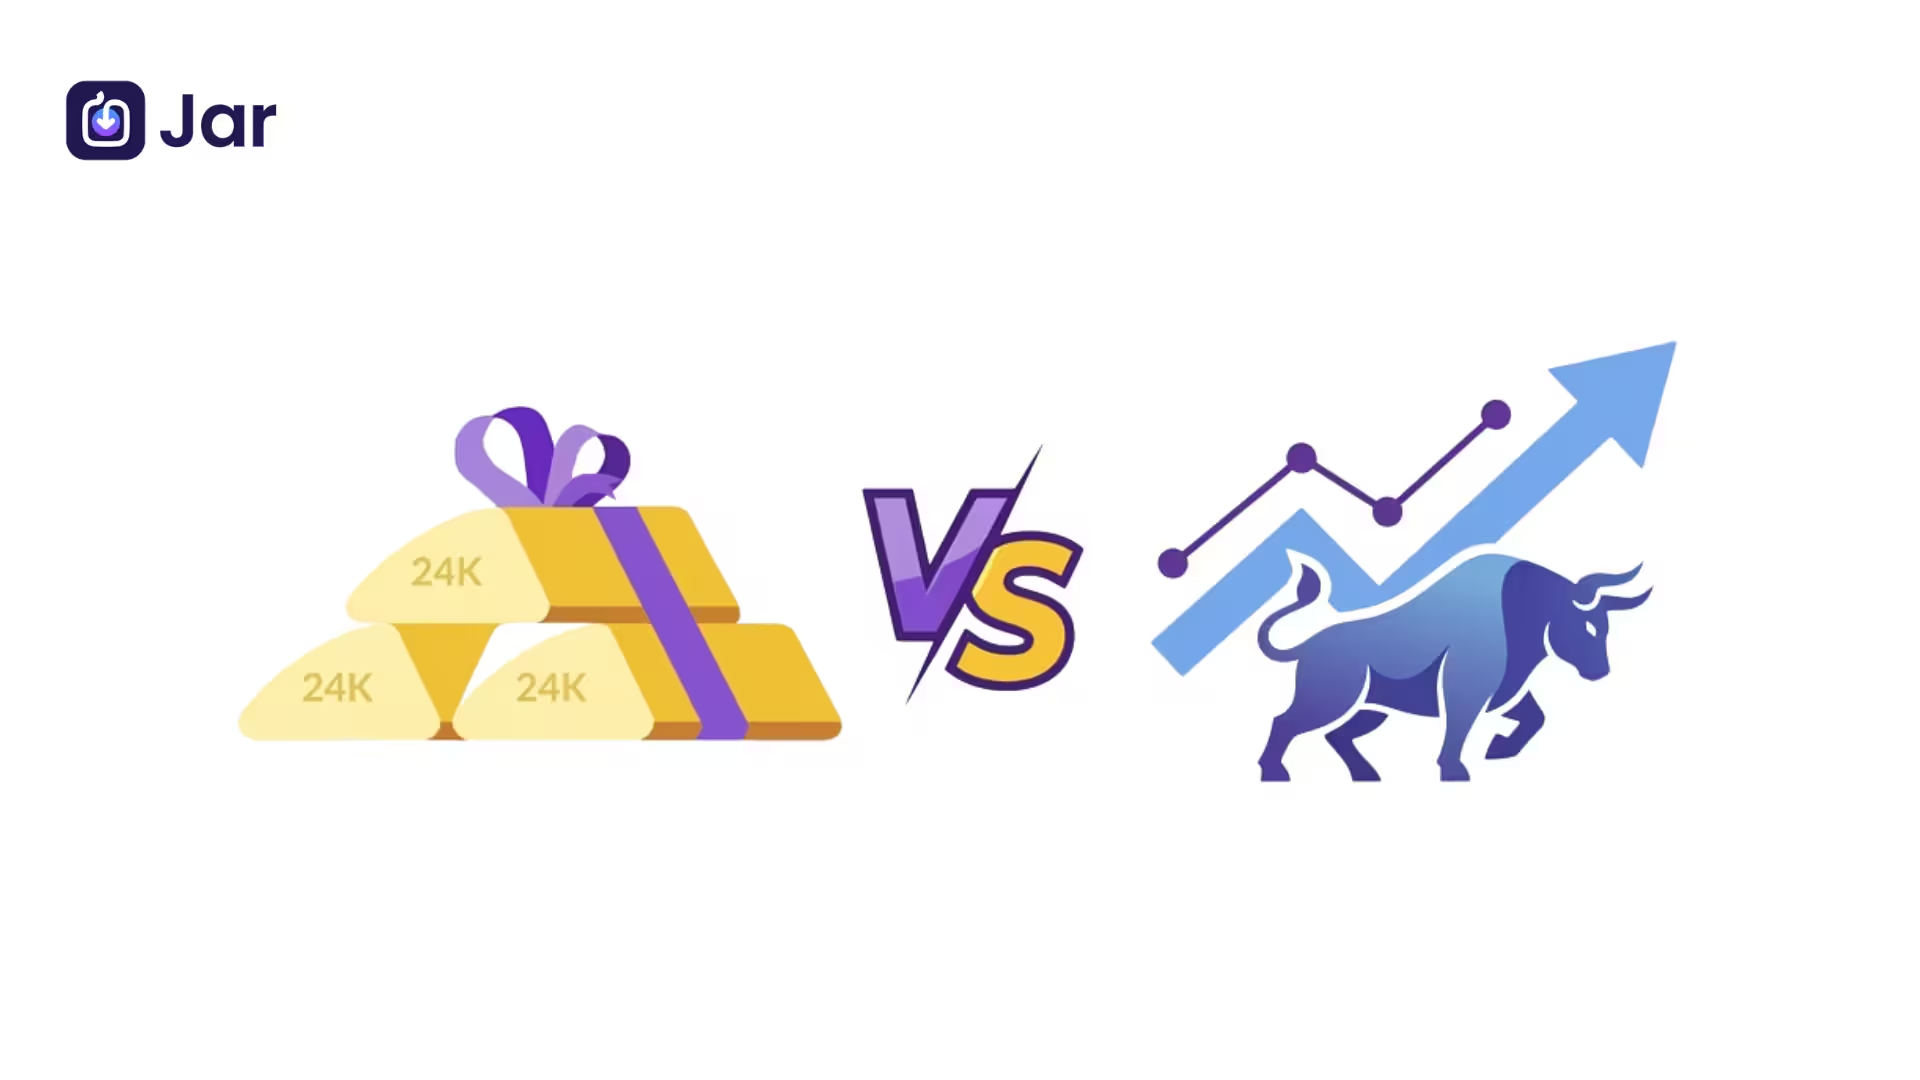
Gold vs Nifty is one of the most common money debates in Indian homes. Gold has been a trusted store of value for generations, while the Nifty 50, which tracks India's largest listed companies, is the default choice for many long-term equity investors.
Over the past decade, the two have taken turns leading. A review published in late 2025 found gold ahead over ten years, with an annualised return of about 16.9% against roughly 13.7% for the Nifty 50.
That lead came during a decade full of global shocks, so the story is more nuanced than one number. In this guide, we look at how each asset performed year by year, what drives their prices, how their risk compares, and how you can use both without staking everything on one.
Quick Snapshot: Gold vs Nifty
| Factor | Gold | Nifty 50 |
| 10-year return (late-2025 review) | About 16.9% a year | About 13.7% a year |
| 5-year return (same review) | About 20.6% | About 18.6% |
| 3-year return (same review) | About 37.9% | About 13.9% |
| Main return driver | Demand, inflation, currency, global uncertainty | Corporate earnings, economic growth, consumption |
| Income | None (price gains only) | Returns from price, plus dividends not included in the index |
| Typical behaviour | Steady, strongest in uncertain times | Swings more, strongest in growth phases |
| Best role | Protection and diversification | Core long-term growth |
| Liquidity | Can be sold anytime | Easy to sell on exchange during market hours |
Gold vs Nifty: How the Two Stack Up Over the Decade
Looking at the 10-year window is the cleanest way to compare these two. Over that period, gold delivered a higher annual return than the Nifty 50, roughly 16.9% against 13.7% in the late-2025 review. The gap is not huge, but it matters because compounding magnifies small differences over time.
To make this concrete, assume these are compounded annual figures and you invested Rs 1 lakh in each a decade ago. At 16.9% a year, that money would grow to roughly Rs 4.76 lakh. At 13.7% a year, it would grow to roughly Rs 3.61 lakh.
The difference is over Rs 1 lakh, and it came from a decade where gold benefited from a series of global shocks.
The 10-year picture
Gold's edge over the decade was built on strong performance in the later years, when inflation worries, geopolitical tension and currency weakness pushed investors toward safe assets. The Nifty 50 still did well, but its growth was more steady and less dramatic.
Over a longer window, equities have historically rewarded patience, and gold's lead here reflects the particular conditions of this decade rather than a guaranteed pattern.
Shorter windows tell a different story
Gold's lead is even more visible over shorter periods. The same review shows gold returning about 37.9% a year over three years, compared with about 13.9% for the Nifty 50. Over five years, gold still led, but the gap narrowed to about 20.6% against 18.6%.
That narrowing is a useful reminder that leadership changes. A three-year window can look very different from a ten-year window, depending on when you start and stop measuring.
Year-by-Year Returns: Where Each One Led
Annual returns show how the two assets behave in different environments. The table below uses yearly figures where the sources we reviewed agree or where only one source reports the figure. Where sources disagree, we have left the cell blank instead of guessing.
| Year | Gold Return (%) | Nifty 50 Return (%) | Which Led |
| 2016 | 10.2 | 3.0 | Gold |
| 2017 | 4.5 | 28.6 | Nifty 50 |
| 2018 | 5.6 | 3.2 | Gold |
| 2019 | 23.7 | Not shown | Gold (data unclear) |
| 2020 | 25.1 | Not shown | Gold (data unclear) |
| 2021 | -4.0 | Not shown | Gold (data unclear) |
| 2022 | 14.0 | 4.3 | Gold |
| 2023 | 12.5 | 19.0 | Nifty 50 |
| 2024 | 8.0 | 11.5 | Nifty 50 |
Years when gold led
Gold clearly outperformed in years like 2016, 2018 and 2022. In 2022, inflation was a major concern for many households, and gold's reputation as a hedge against rising prices showed up in its returns. Gold's strongest yearly gains in the data appear in the late 2010s and early 2020s, a period marked by global uncertainty.
Years when the Nifty pulled ahead
The Nifty 50 led strongly in 2017, when Indian equities rallied on strong corporate earnings and steady domestic demand. It also led in 2023 and 2024, when the economy's growth story attracted investors back to equities. These years show why the Nifty works as a growth engine when conditions are favourable.
The early years of the decade
Earlier in the decade, the picture was even more lopsided in places. Based on one review, gold posted negative returns between 2013 and 2015, while the Nifty 50 jumped about 31% in 2014. By 2021, the index had nearly tripled from its end-2013 level, which shows how much equity growth can accumulate once markets recover. Gold's slump in those years is a reminder that it is not immune to long periods of weakness either.
What Drives Gold and the Nifty 50
Understanding what moves each asset helps you judge whether the past ten years are likely to repeat. The two respond to very different forces.
What moves gold
Gold prices tend to rise when investors feel uncertain. Currency weakness, inflation worries, geopolitical events and large-scale buying by central banks all push demand up. Because gold does not produce cash flows, its price depends mostly on what other investors are willing to pay for it in the future. That makes gold a store of value rather than a source of earnings.
What moves the Nifty 50
The Nifty 50 reflects the combined performance of its 50 constituent companies. Its direction depends on corporate profits, interest rate decisions, domestic consumption, credit growth and the health of key sectors.
When Indian businesses grow and become more profitable, the index tends to follow. Because the index is built from businesses rather than a physical commodity, it has the ability to compound as earnings grow.
Volatility and the ride
Gold generally moves in smoother patterns. It can sit in a range for long stretches before rising sharply during a crisis. The Nifty 50 displays more frequent swings in response to daily news, quarterly results and shifts in market sentiment.
It also tends to recover strongly over longer periods, but that recovery requires you to stay invested through the rough patches. For many investors, the question is not which asset is better on paper, but which one they can hold through a bad year without panicking.
Where Fixed Deposits Fit In
Fixed deposits are often the first choice for risk-averse savers, and they belong in this conversation. Based on one review, FD rates in India declined from roughly 9% to around 5% over the eight years to 2021. With inflation running at around 6% during part of that period, the real return on fixed deposits could have been close to zero or even negative after tax.
This is why many investors look beyond FDs for growth, even though they still provide certainty and capital protection. Gold and equity both carry more risk than an FD, but they have offered returns that can outpace inflation over long periods.
Where Each Asset Fits in Your Portfolio
Gold and the Nifty 50 do different jobs. Gold is usually best seen as a defensive asset. It can help cushion a portfolio when equities fall, and it tends to hold its value during inflation spikes or currency stress.
The Nifty 50 is usually better suited to the growth side of a portfolio, where the goal is to build wealth over many years through compounding.
When gold makes sense
Gold can be a useful addition if you are worried about inflation, want to reduce the swings in your portfolio or are investing for goals where protecting capital matters more than maximising growth. Physical gold, gold ETFs and digital gold each come with different costs, storage needs and liquidity, so it is worth understanding those trade-offs before you buy.
When the Nifty makes sense
Index investing through Nifty 50 funds is a simple way to own India's largest companies without picking individual stocks. It suits people with a longer time horizon who can accept short-term drops in exchange for higher long-term potential. Because the index includes dividends when reinvested through a fund, a total return approach can improve the outcome compared with the headline index figures.
A balanced approach often works better than choosing one winner. Gold can cushion the ride when equities are under pressure, and the Nifty can drive growth when the economy is expanding. The right mix depends on your age, income stability, goals and how much volatility you can live with.
Common Mistakes to Avoid
Many investors make the same few errors when comparing gold and equity. The first is chasing last year's winner. Gold's strong recent run may tempt you to go all in, but leadership rotates, and buying after a big rally can leave you exposed if conditions change.
The second is ignoring time horizon. A three-year view can look very different from a ten-year view, so decide how long you can stay invested before you choose.
The third mistake is comparing price returns without considering costs and taxes. Gold has storage and making charges if you buy physical jewellery, and both assets have tax rules that depend on how long you hold them.
Tax rules change from time to time, so check the current rules or speak to a tax professional before making decisions. The fourth is forgetting that index returns exclude dividends, which means the true equity return may be higher than the headline index figure.
Conclusion
Gold vs Nifty is not a contest with a permanent winner. Over the last decade, gold had an annualised return of about 16.9%, compared to roughly 13.7% for the Nifty 50, but the Nifty outperformed in several individual years and has a strong record of compounding when the economy is growing.
The decade favoured safety during a series of global shocks, and that may not repeat in the same way. For most investors, the practical takeaway is to understand what each asset does. Gold protects and steadies, while the Nifty grows and compounds.
Choosing the right mix for your own goals and time horizon will matter far more than picking last decade's winner.
Frequently Asked Questions
Did gold beat the Nifty 50 over the last 10 years?
According to a late-2025 review, gold delivered an annualised return of about 16.9% over ten years, compared with about 13.7% for the Nifty 50. The result depends on the exact start and end dates, so the answer can shift if you measure over a different window.
Is gold safer than the Nifty 50?
Gold usually swings less sharply than the Nifty 50, which is why many investors treat it as a defensive asset. However, gold can still fall for long periods, as it did between 2013 and 2015 in one review. Neither asset is risk-free.
Should I choose gold or the Nifty 50 for long-term investing?
For most long-term investors, the Nifty 50 is the core growth option, while gold works better as a supporting asset for diversification and protection. Your choice should depend on your goals, time horizon and comfort with market swings.
Why has gold performed so well recently?
Gold has tended to rise during periods of global uncertainty, inflation worries and currency weakness. Strong buying by central banks in several countries has also supported prices.
Does the Nifty 50 always beat gold?
No. The Nifty 50 led in some years, such as 2017, 2023 and 2024, while gold led in others. Leadership shifts with economic conditions, so no single asset wins every year.
How do I invest in gold or the Nifty 50?
You can invest in gold through physical forms, gold ETFs, gold mutual funds or digital gold platforms. For the Nifty 50, index funds and ETFs that track the index are a common route. Compare costs, liquidity and tax treatment before you decide.