Understanding and Eliminating Unnecessary SwiftUI View Recompositions
6 min read · Written by Kartikeya Singh
Eliminated long-running view body updates across multiple SwiftUI screens—improving frame stability, reducing CPU load, and preventing dropped frames and UI stutter during interactions and animations.
Your UI is smooth.
Your animations look perfect.
Your code is “clean SwiftUI”.
And yet—Instruments is screaming red.
Long View Body Updates.
Main-thread churn.
Frame drops that only show up after you ship.
These are the SwiftUI performance problems that rarely surface through visual inspection, but consistently appear under profiling. They are not caused by complex layouts or elaborate animations, but by how often SwiftUI is asked to perform work it does not need to do.
SwiftUI’s declarative model is designed to handle frequent updates efficiently, provided that view bodies remain cheap to evaluate and state changes are meaningful from the UI’s perspective. When state is published at a higher frequency or precision than the interface requires—or when expensive logic runs inside the render cycle—those assumptions break down. The result is excessive view recomposition and avoidable main-thread work.
This post explores several real-world optimisations where expensive, reactive view logic was transformed into predictable state. By aligning state publication with visible UI intent, moving computation out of the render path, and allowing animations to interpolate naturally, we significantly reduced SwiftUI view recompositions—often by approximately 90%—without altering any visual behaviour.
Through a set of focused case studies, this article shows how refining state-propagation boundaries for time-based and event-driven state in SwiftUI can measurably reduce view recomposition, improve frame stability, and lower main-thread rendering cost.
1) GoldPriceTimerProgressView:
Eliminating Long View Body Updates in SwiftUI Timer Animations
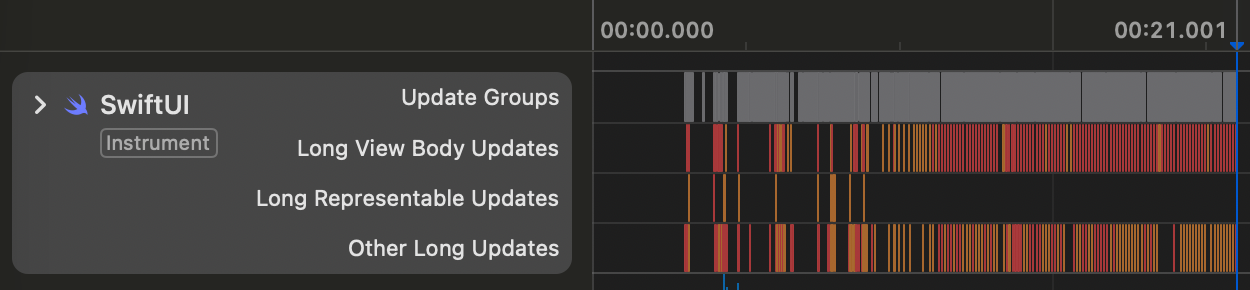
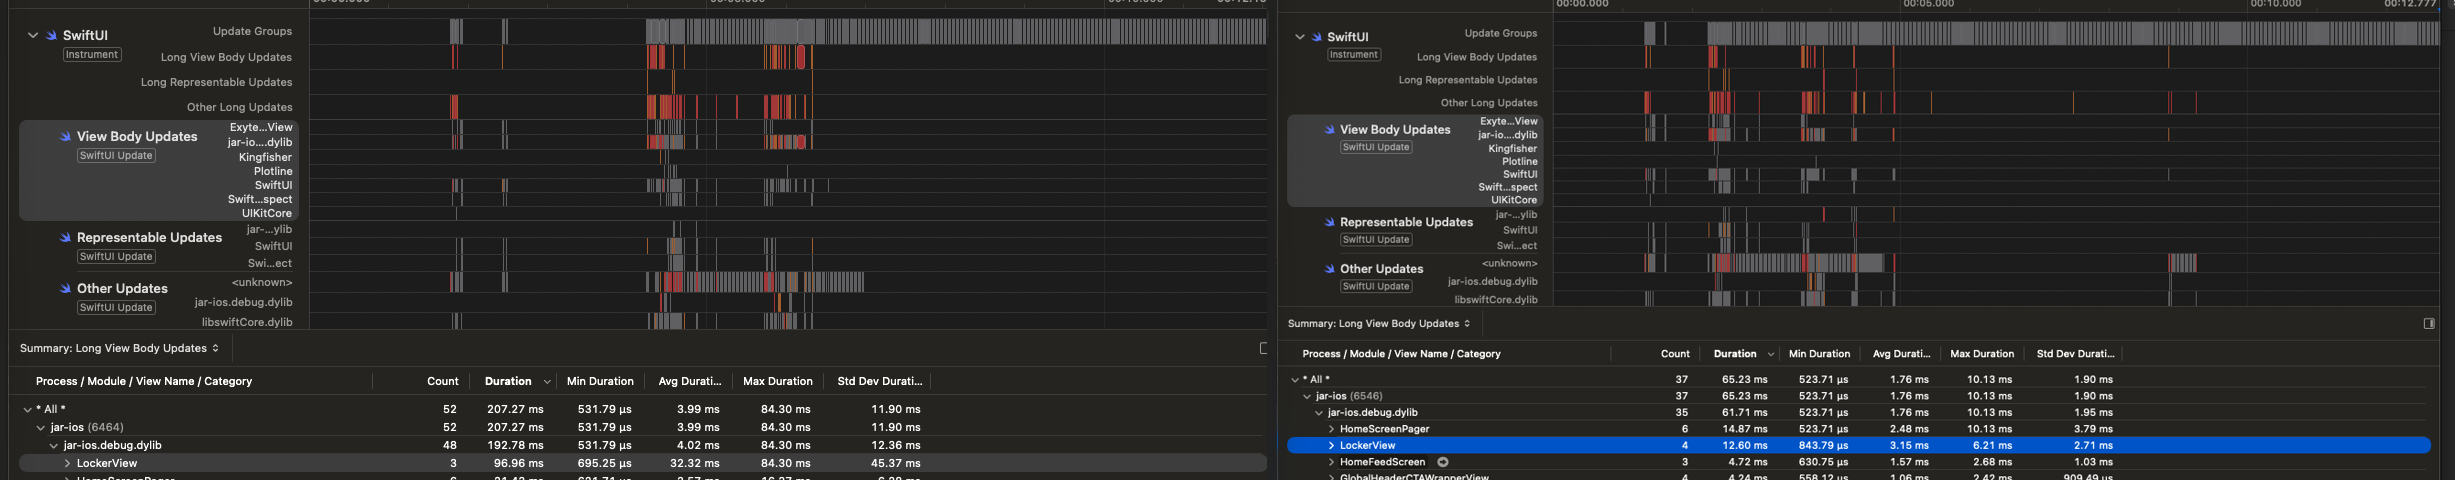
Note: Red regions show expensive SwiftUI view recompositions (Long View Updates), which are undesirable in production.

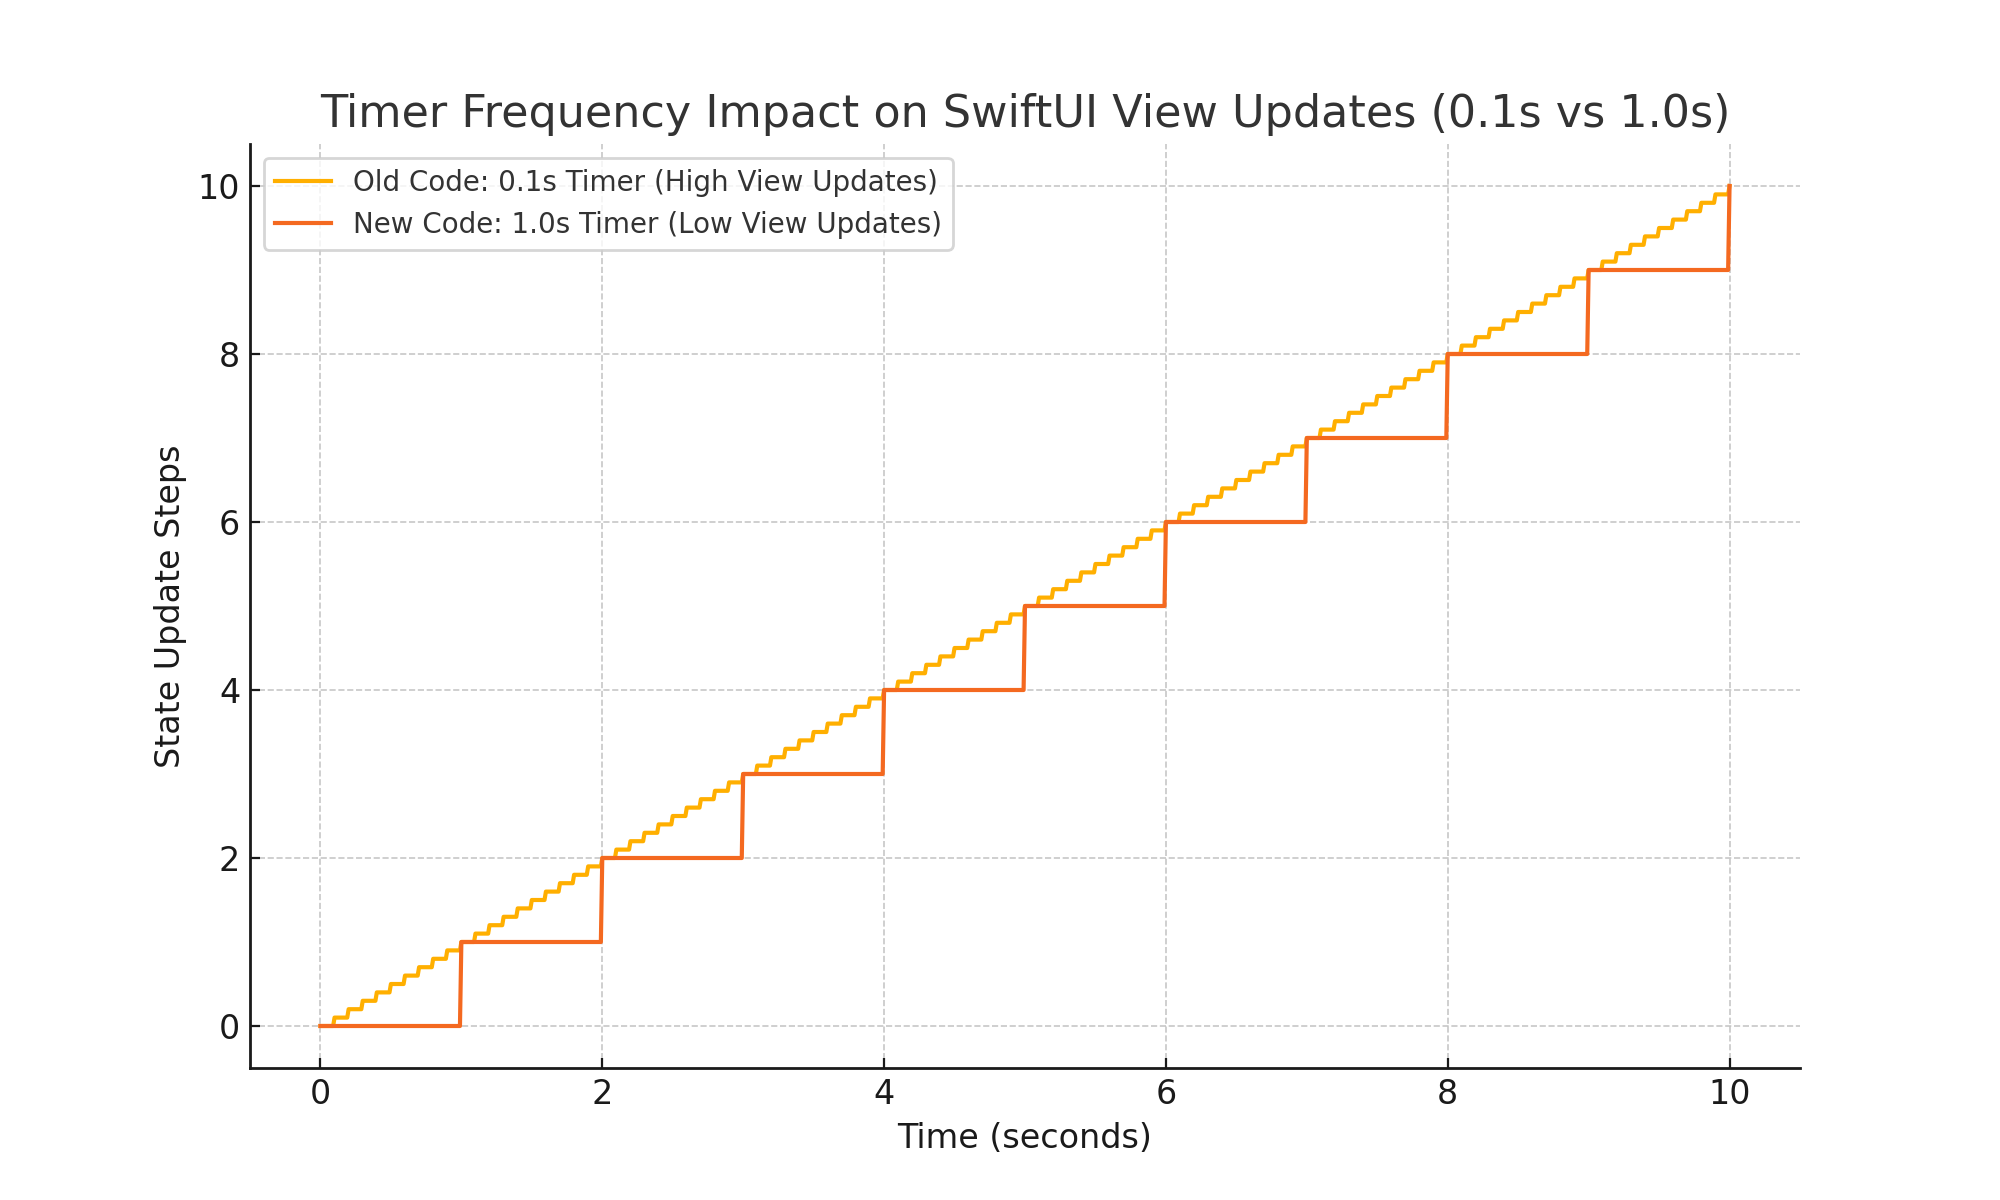
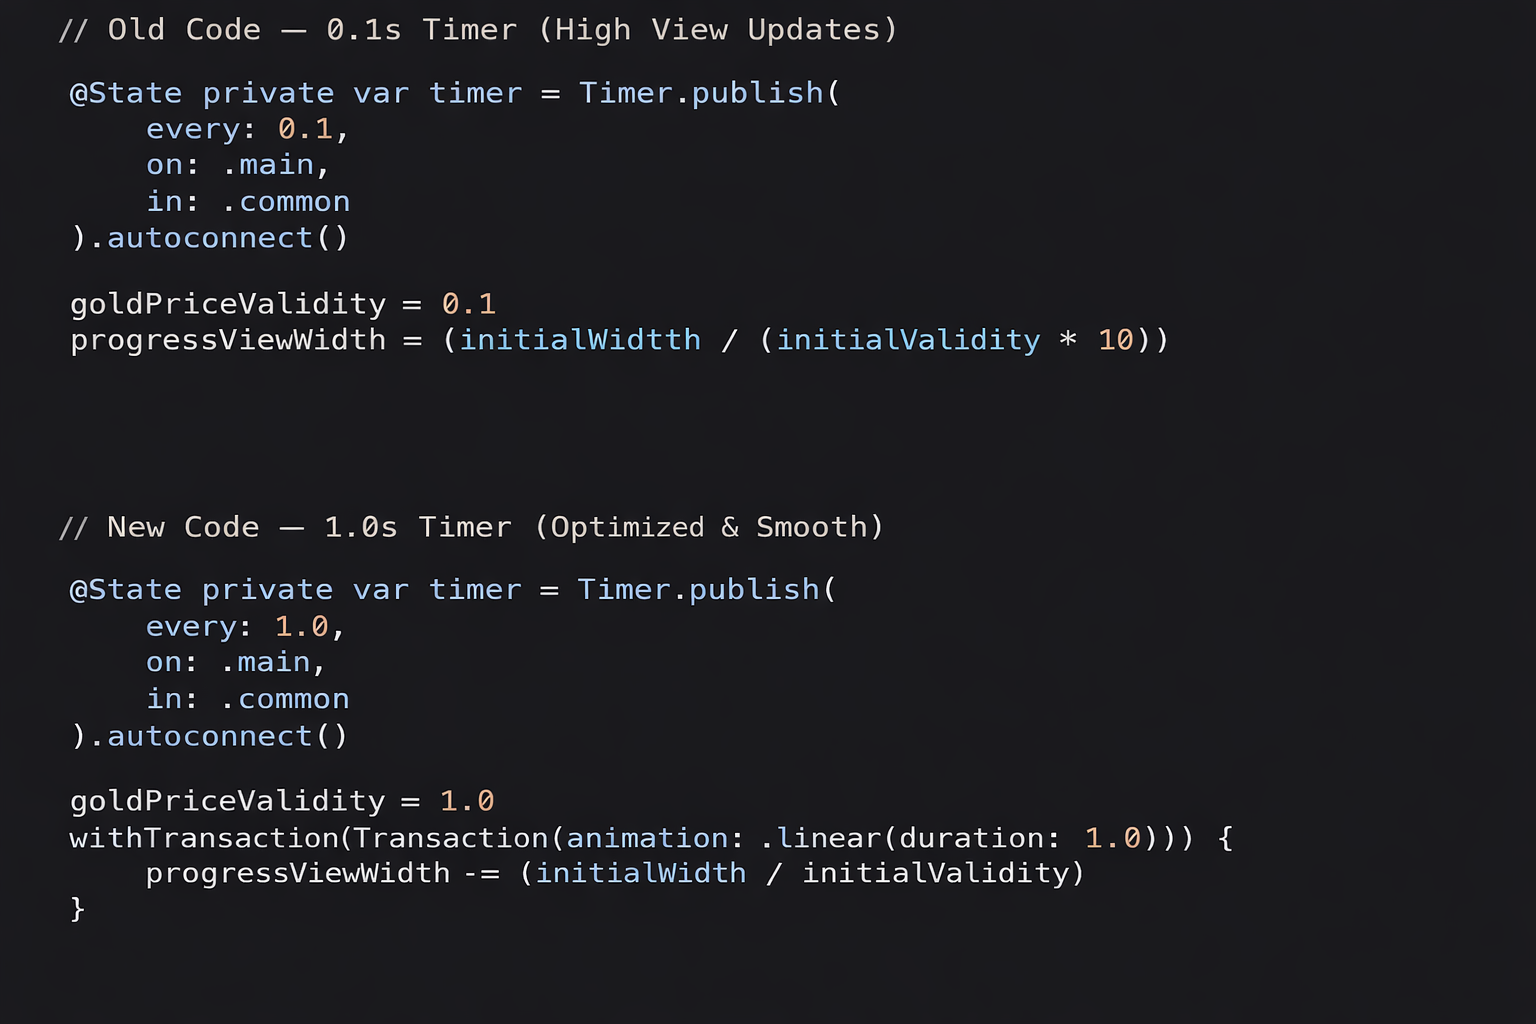
On the Buy Gold Screen, the gold price timer progress bar was originally driven by a0.1s timer. That meant the UI was updating 10 times every second, and each of those updates triggered a full SwiftUI view recomposition.
Visually the progress bar looked fine — but when we profiled the screen in Instruments, we saw recurring Long View Body Update spikes. The issue wasn’t the animation — it was how we were driving it.
SwiftUI was being asked to re-render the view ten times a second instead of letting the system interpolate frames smoothly.
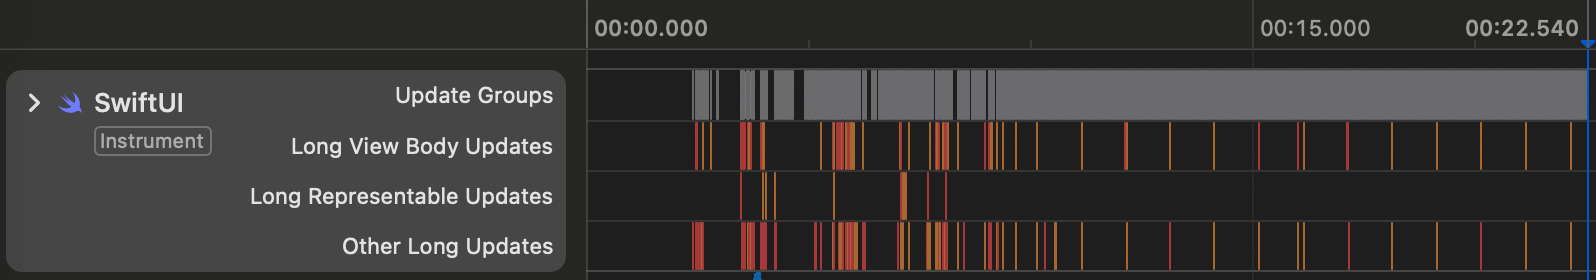
So we redesigned the timer.
We replaced the 0.1s tick model with:
- a 1-second logical timer for validity + text, and
- a single continuous linear animation for the progress bar
Now the animation plays smoothly over the full second, while the main thread does far less work.
The UI looks identical — but the rendering pipeline is significantly lighter.
Impact
- ~90% fewer SwiftUI view updates
- Long View Body Update spikes eliminated
- Better FPS stability and lower CPU cost
- Zero visible behaviour change
We’ve since applied this optimization across other timer-driven and animated flows, wherever unnecessary view recomposition was causing subtle frame drops and UI stutter.
2) LockerView Optimisation Summary:
Optimising LockerView: Cutting SwiftUI Long View Updates by ~90%
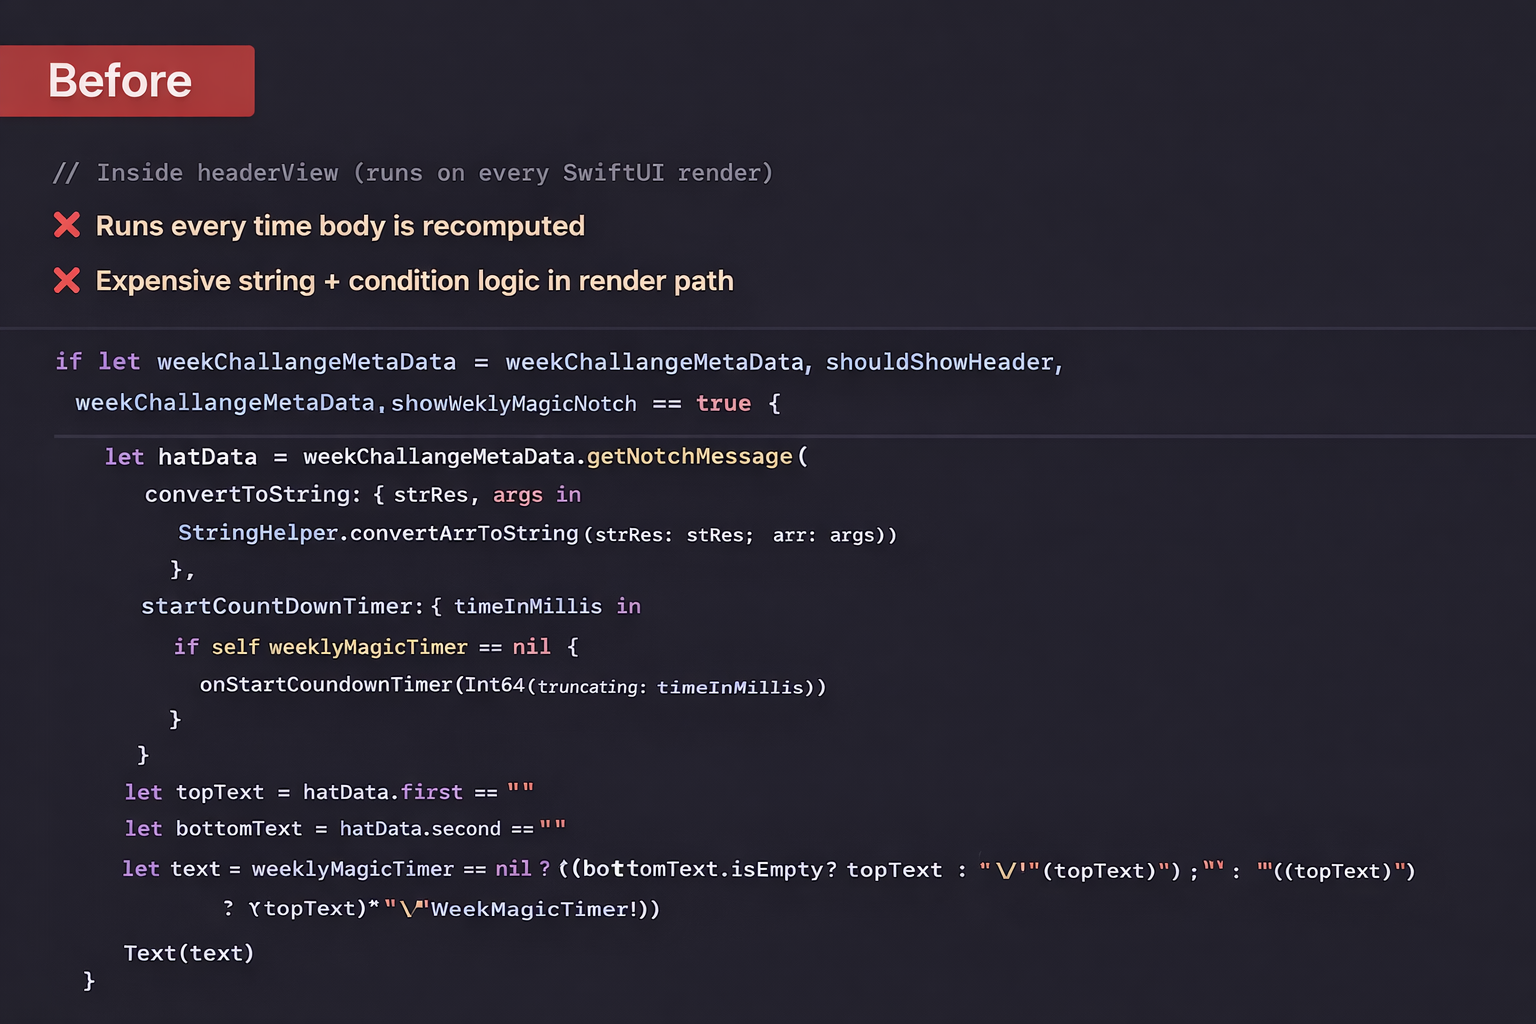
SwiftUI makes it incredibly easy to build rich, declarative UIs—but that convenience can sometimes hide expensive work happening inside the render cycle. In our case, HomeLockerView was suffering from noticeable performance overhead due to repeated text computation during view updates.
This post walks through what was wrong, what we changed, and the measurable impact of that optimisation.
Note: If a view receives data that does not belong in the ViewModel, it can be safely handled and precomputed within the SwiftUI view itself.
The Problem: Expensive Work Inside the Render Cycle
LockerView included a piece of logic called Weekly Magic Notch text computation.
While functionally correct, this logic was being recomputed during SwiftUI’s view rendering.
Whenever SwiftUI decided to re-evaluate the view body—due to state changes, timers, or metadata updates—the same expensive computation ran again.
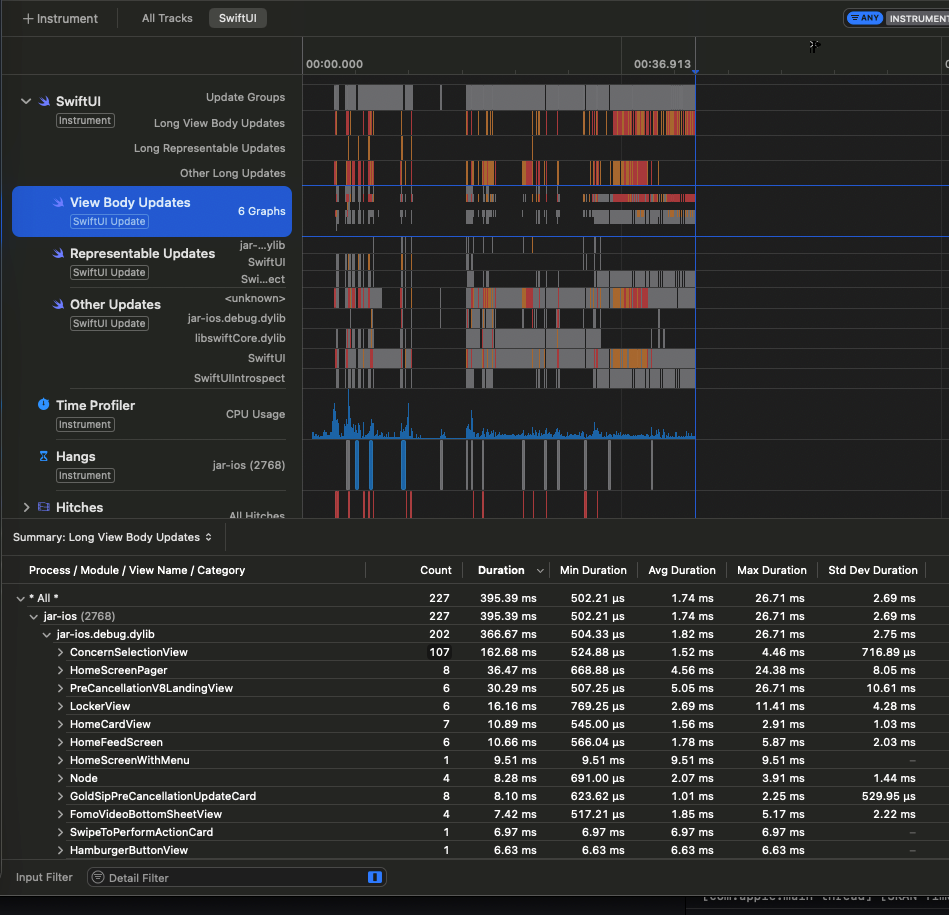
In Instruments, this showed up clearly as Long View Updates, highlighted in red.
Symptoms:
Frequent Long View Update spikes
- UI responsiveness risk on lower-end devices
- Computation tied directly to SwiftUI’s diffing and rendering lifecycle
What We Changed:
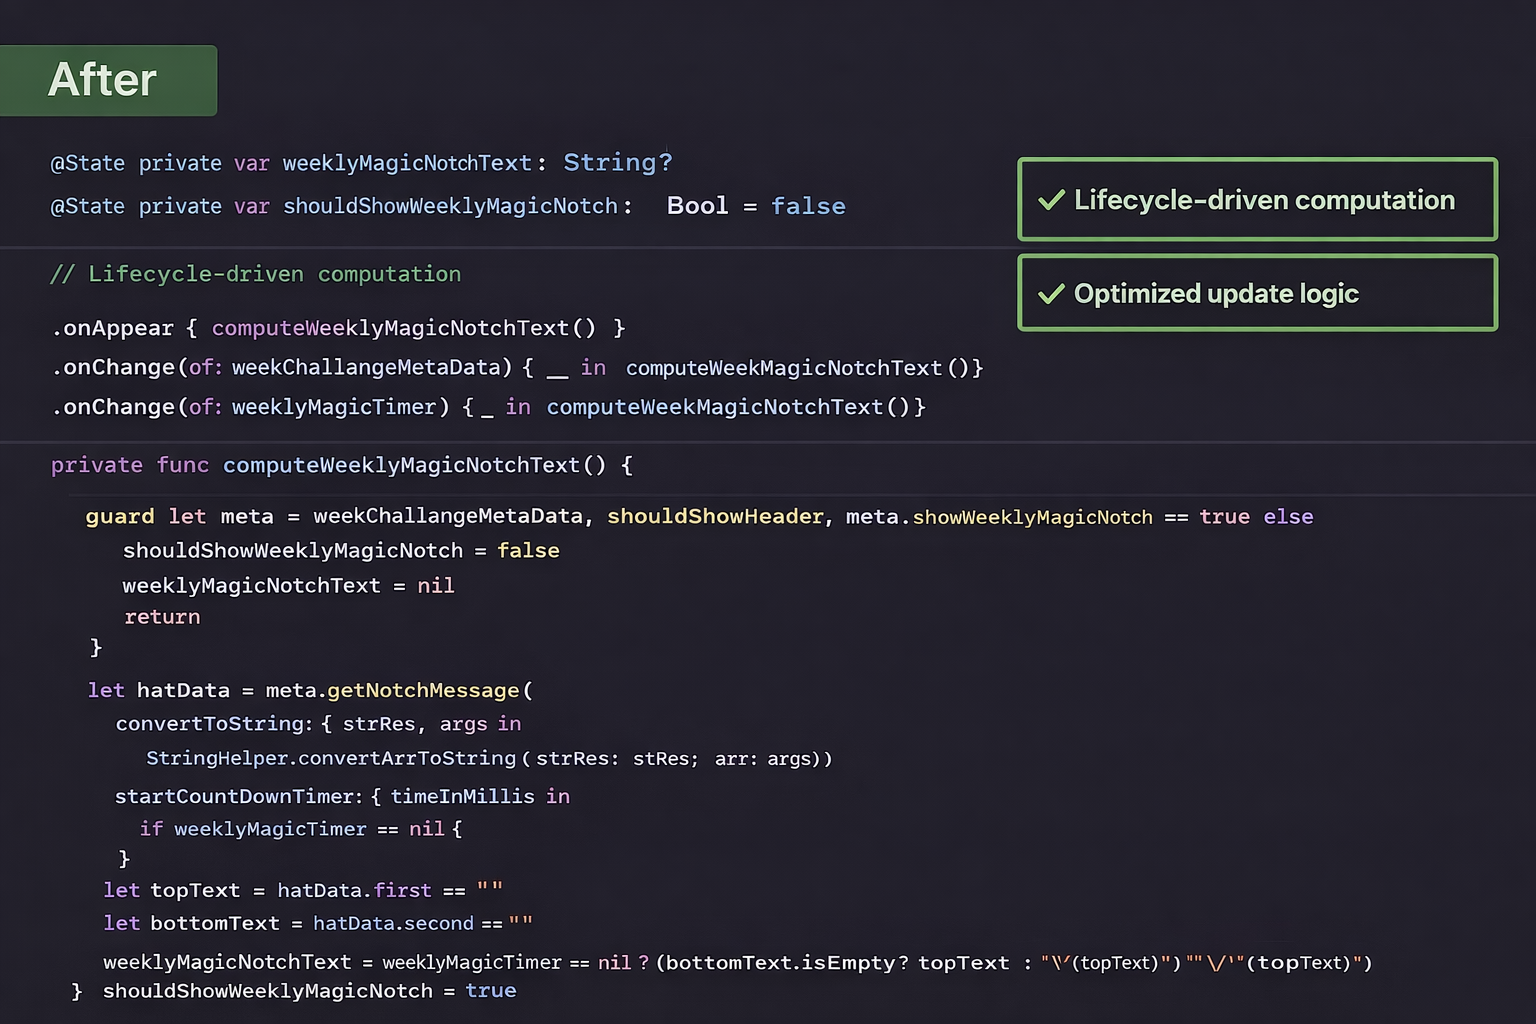
We moved the computation out of the render cycle and into a precomputed @State:
@State private var weeklyMagicNotchText: String = ""
The value is now updated only when needed, using:
onAppearonChange(of: weekChallangeMetaData)onChange(of: weeklyMagicTimer)
This keeps the body lightweight and cheap to re-evaluate.
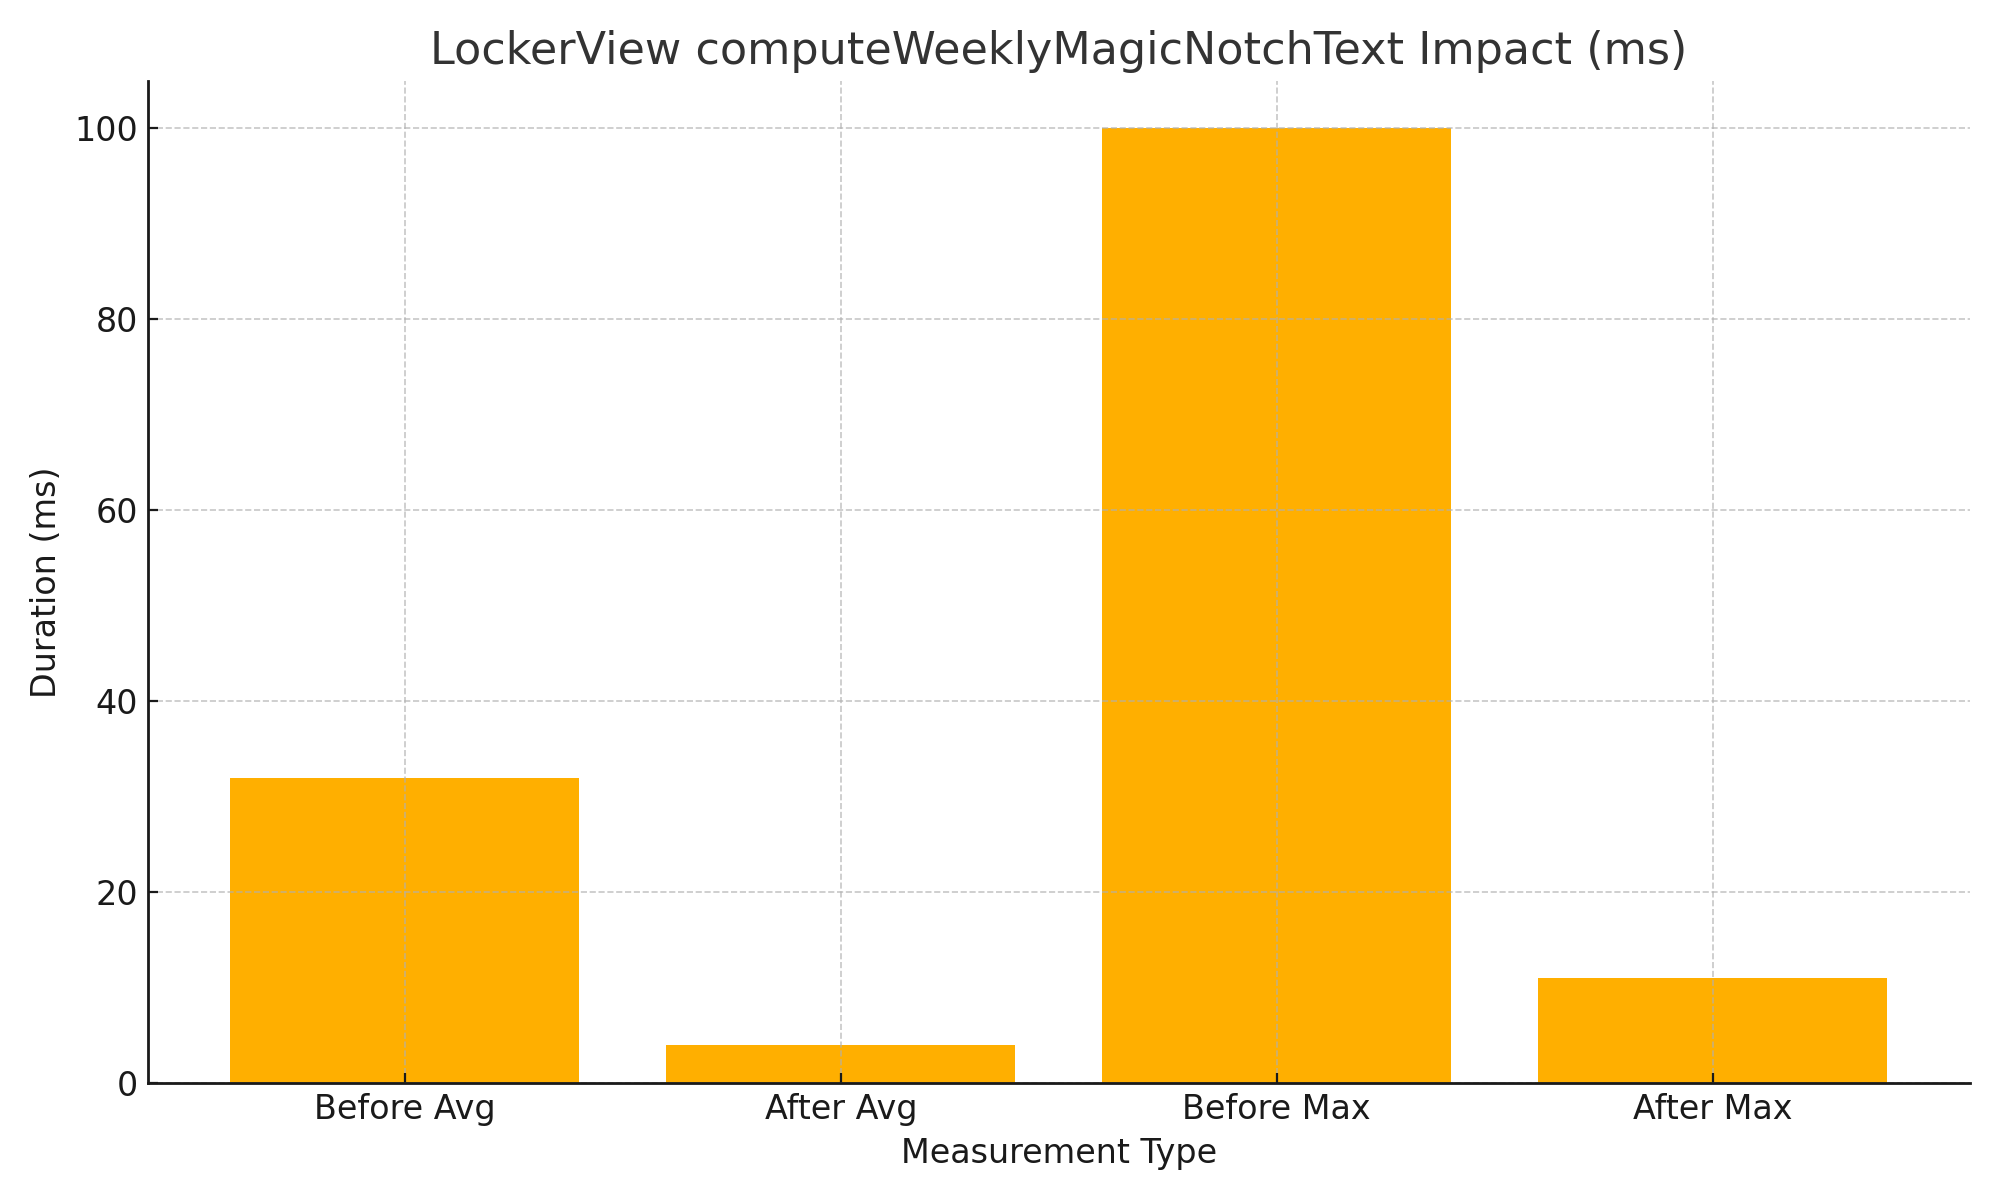
📊 Measured Impact (From Instruments)
| Metric | Before | After | Improvement |
|---|---|---|---|
| Avg Long View Update | ~32 ms | ~3 ms | ~90% reduction |
| Max Long View Update | ~84 ms | ~11–12 ms | ~85% reduction |
Previously, this logic was being executed inside headerView during every body re-computation, which caused frequent and costly string processing, countdown triggers, and layout invalidations.
Why This Matters
SwiftUI encourages frequent view updates—but that only works well if:
- The
bodyis pure and cheap - Heavy logic is decoupled from rendering
- State changes are intentional and scoped
By extracting computation into @State, we:
- Reduced render-time work
- Eliminated unnecessary recomputation
- Made performance issues visible and fixable via Instruments
Key Takeaways
- 🚫 Avoid expensive logic inside
body - ✅ Precompute derived values using
@State - 🎯 Update state only when its true dependencies change
- 🔍 Use Instruments’ Long View Updates to spot hidden bottlenecks
Final Thought
This optimisation didn’t change a single pixel of UI—but it dramatically improved runtime efficiency.
It’s a great reminder that SwiftUI performance is less about fewer views and more about cheaper updates.
If you’re seeing red in Instruments, chances are the fix is architectural—not cosmetic.
3) 🎧 AVPlayer Progress Publishing Optimisation — Reduction in SwiftUI View Recomposition
Context
The audio player updates playback state using an AVPlayer periodic time observer.
In the earlier implementation, both currentTime and progress were published every 0.1 seconds, regardless of whether the UI visually changed.
This resulted in a high frequency of @Published emissions, which flowed directly into SwiftUI’s diffing pipeline—causing frequent view recompositions and increased rendering work during audio playback.
ConcernSelectionView
Problem Observed
During playback, ConcernSelectionView showed a high number of Long View Body Updates in Instruments.
- Before: 107 Long View Updates
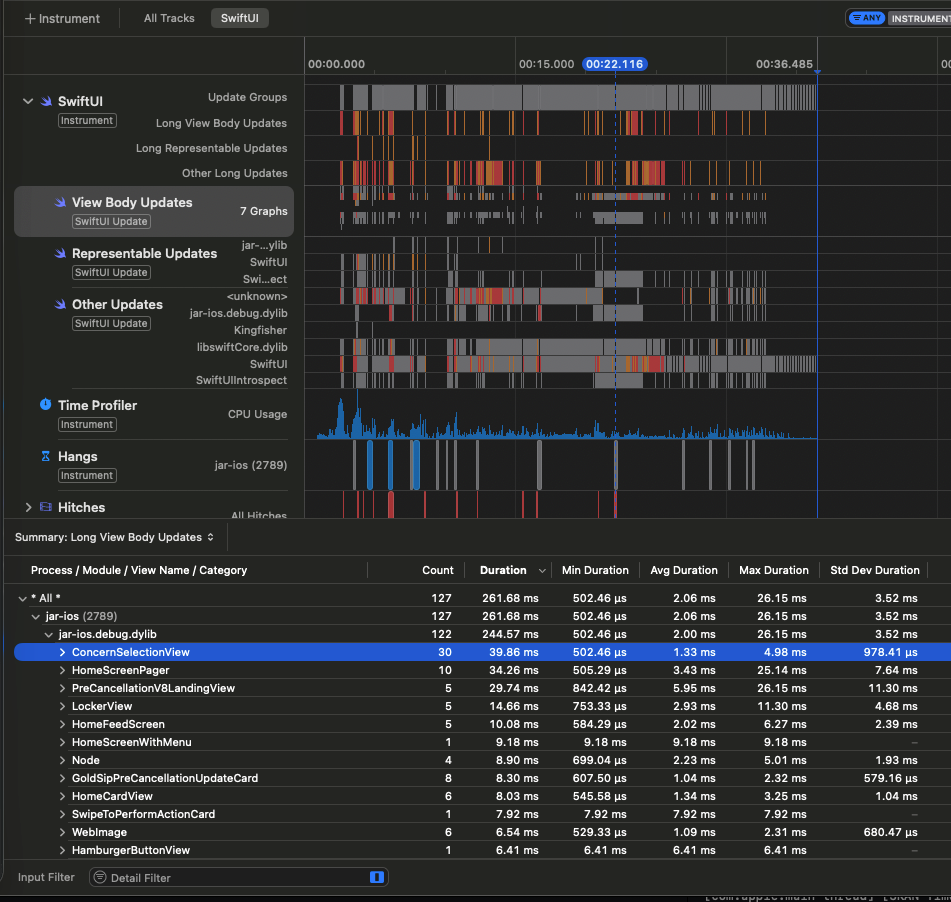
- After: 30 Long View Updates
This clearly indicated excessive state churn rather than complex layout or animation issues.
Before - ConcernSelectionView had 107 Long View Updates
After - ConcernSelectionView has 30 Long View Updates
Code Change:
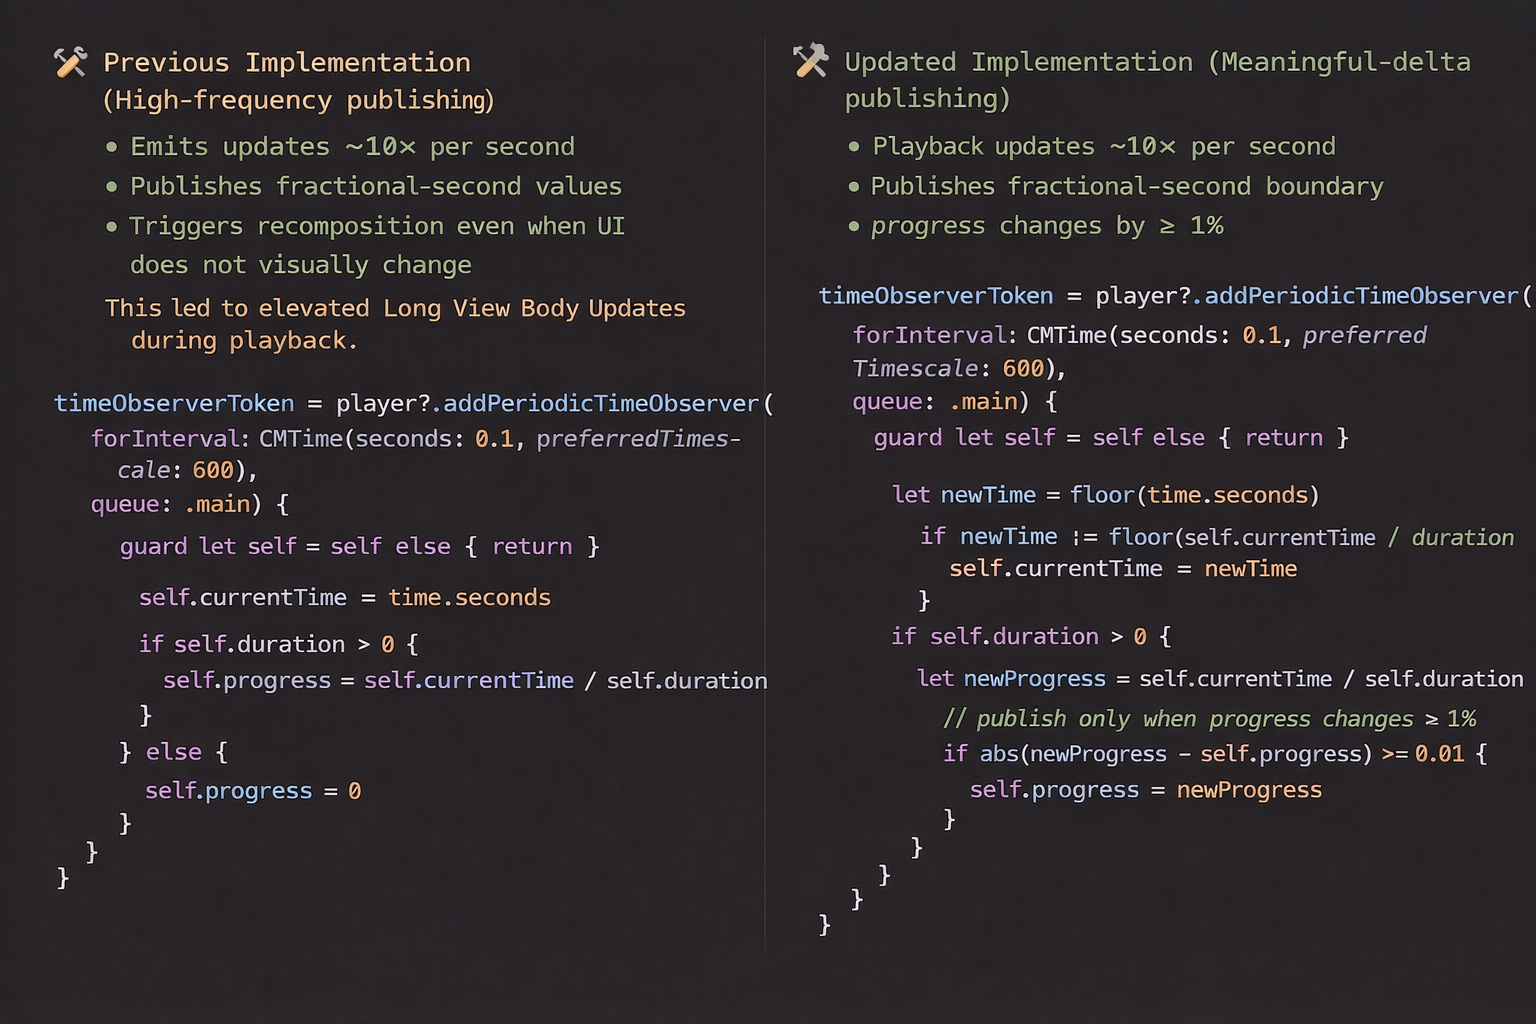
🎯 Design Intent
| Change | Purpose |
|---|---|
| Round timestamps to whole seconds | Avoid recomposition for fractional-second movement |
| 1% minimum progress delta | Prevent micro-updates that don’t affect UI |
| Event-driven publishing | Align rendering work with visible changes |
Instead of reacting to raw playback ticks, the player now emits semantic UI state transitions.
📊 Observed Impact (Instruments)
| Metric | Before | After |
|---|---|---|
| Long View Body Updates | 107 | 30 |
| Progress emissions | Continuous | Throttled |
| Layout invalidations | Frequent | Reduced |
| Animation stability | Interrupted | Smooth |
The reduction is driven by lower state churn entering SwiftUI’s diffing pipeline, not by view restructuring or animation changes.
🧠 Engineering Approach
- Treat playback updates as UI state, not a streaming signal
- Optimise at the source instead of:
- debouncing in views
- memoising computed properties
- splitting layout structures
- Publish only when:
- the value changes at visible precision, and
- the UI outcome differs
🔎 Extensions / Applicability
This optimisation pattern is well-suited for cases where second-level progress updates are sufficient, such as:
- timers
- progress indicators
- waveform or playback status displays
- gesture or action confirmation flows
Publishing state only when values change at whole-second precision helps minimise unnecessary recompositions and keeps UI rendering efficient.
Summary
This optimisation converts frequent AVPlayer ticks into semantic UI updates, reducing recomposition overhead and improving runtime rendering efficiency with a minimal, isolated code change.