Boosting Jar’s Cold Start by 40%. Goodbye Janks, Hello Async NavGraph Inflation [Part-2]
13 min read · Written by Soumen Paul
It’s been a few months since we struck our first gold bar — our initial performance deep dive where we explored how Baseline Profiles, Startup Profiles, Metrics Manager, and more gave our app a serious performance lift. If you missed that, do yourself a favor and check it out here
It’s been a few months since we struck our first gold bar — our initial performance deep dive where we explored how Baseline Profiles, Startup Profiles, Metrics Manager, and more gave our app a serious performance lift. If you missed that, do yourself a favor and check it out here — it’s pure engineering gold.
But this time, we’re not just bringing a gold bar to the table.
We’ve hit a gold mine. 💥
From startup time reductions to smarter rendering paths, this next phase of performance evolution goes even deeper — more insights, more impact, and even more engineering alchemy. Let’s dig in.
Sharper, Faster, Smarter Glance
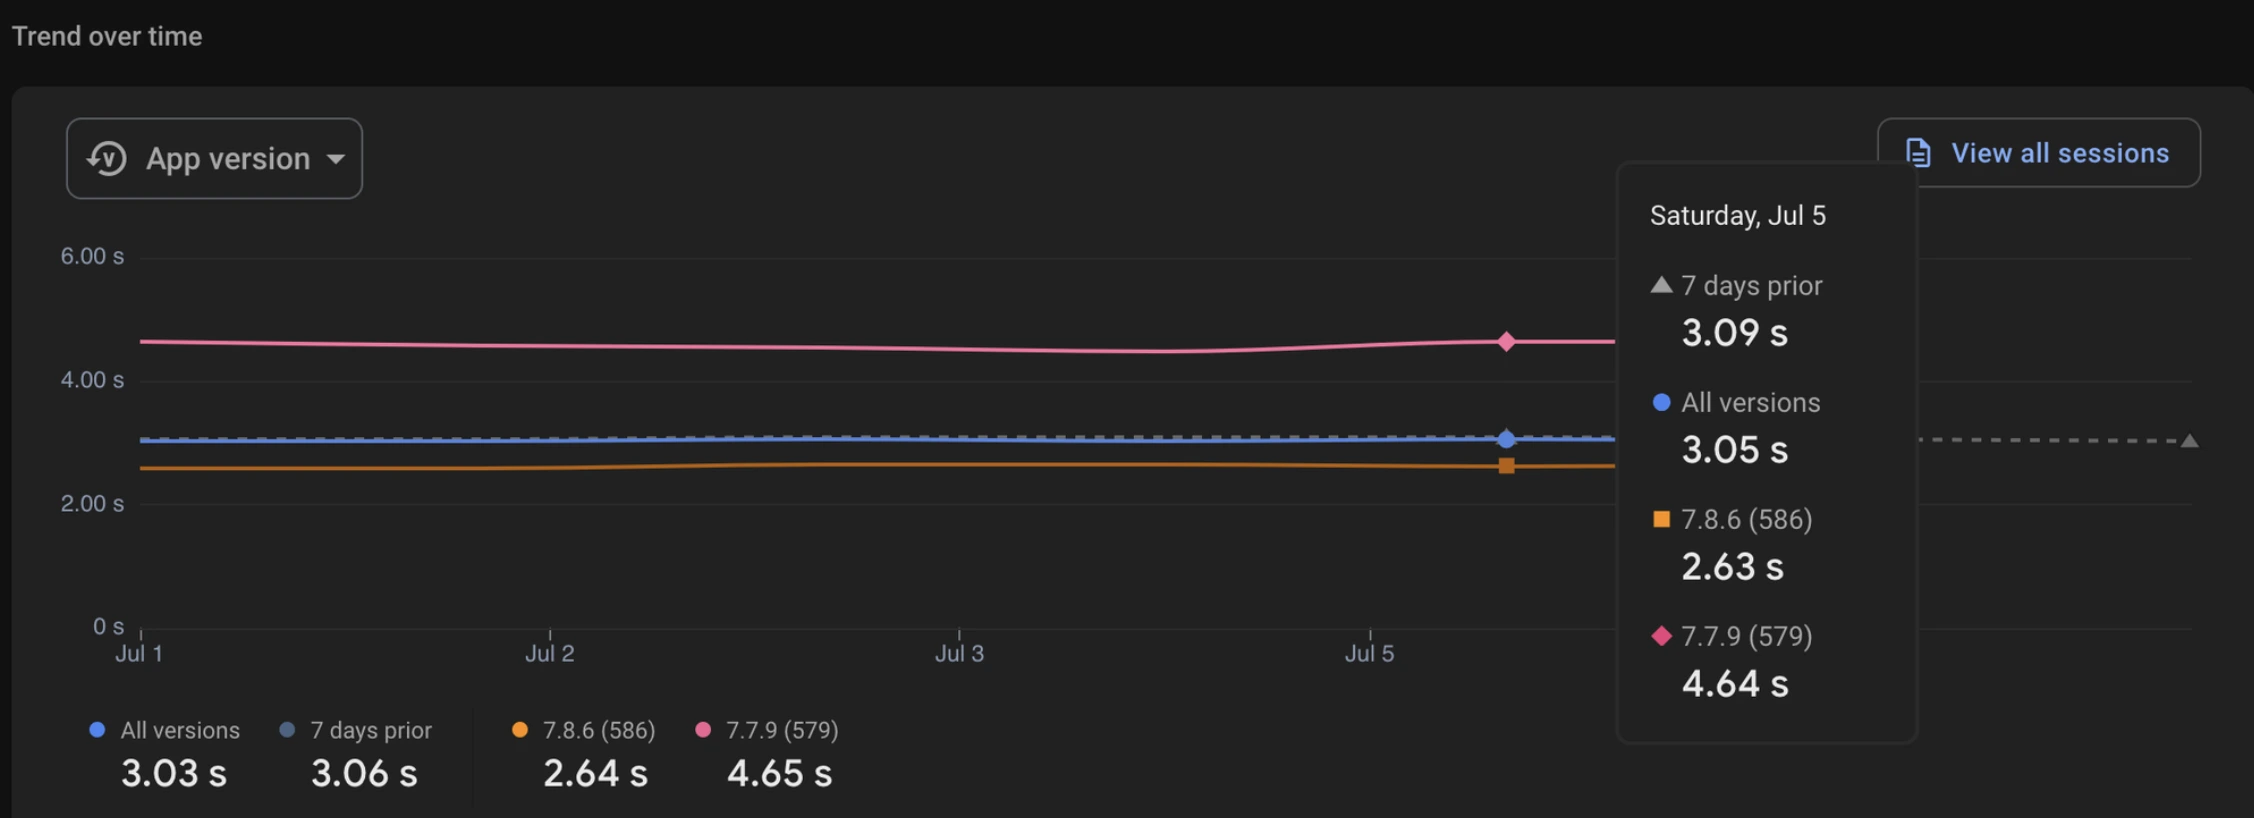
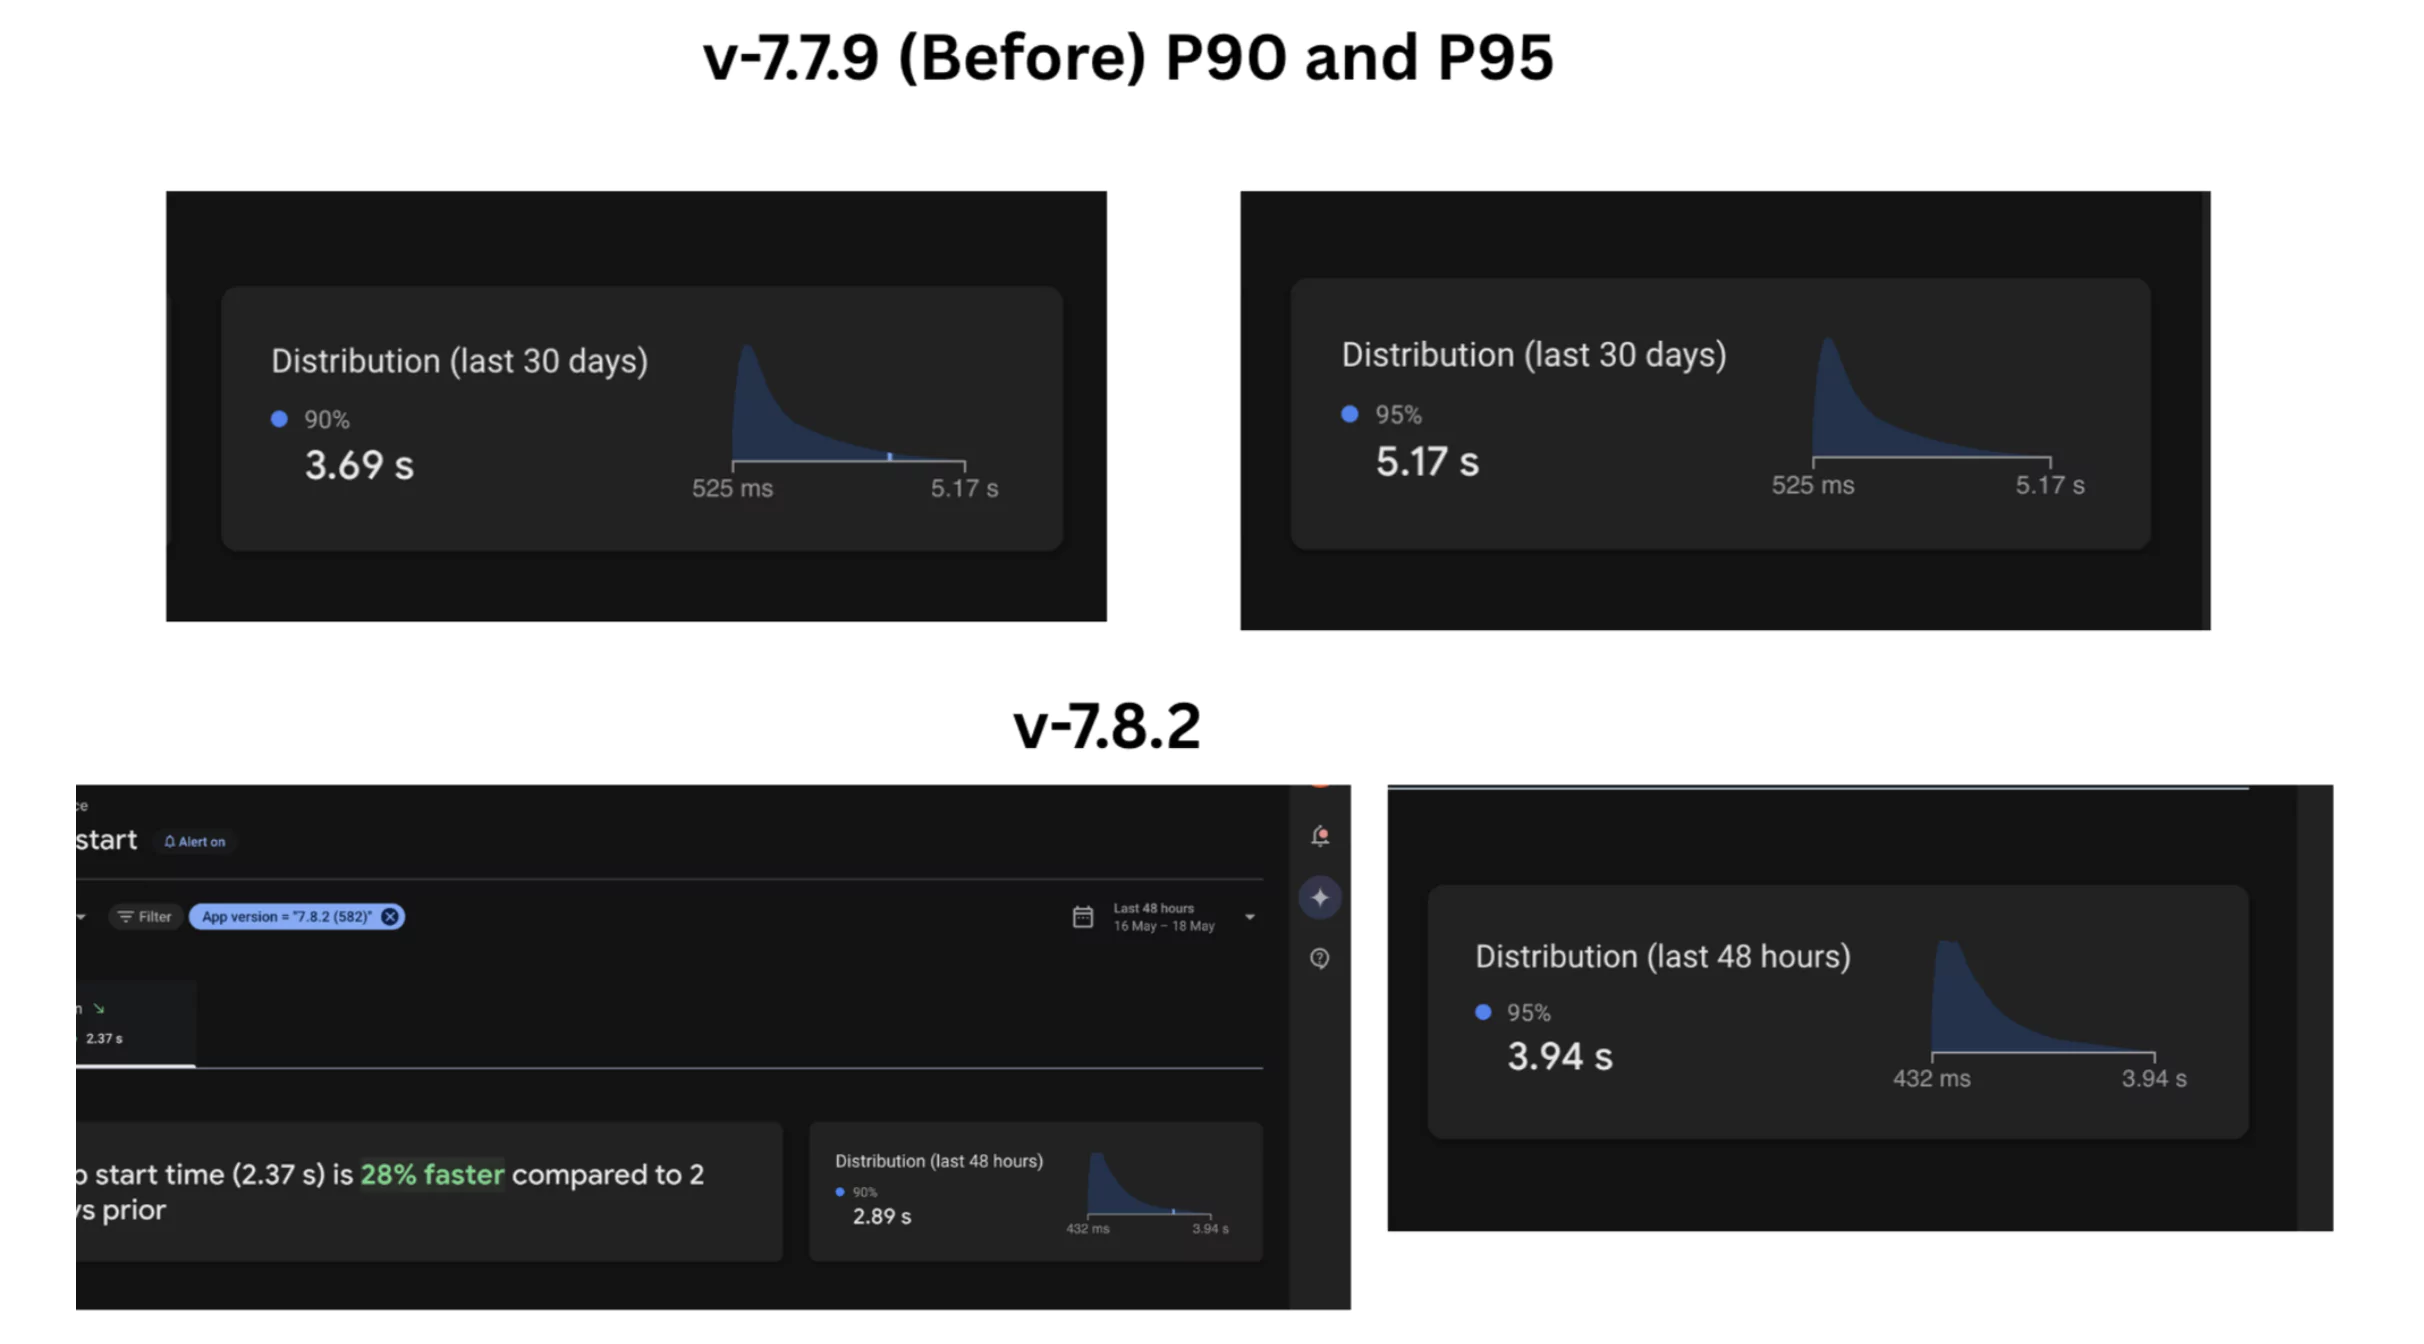
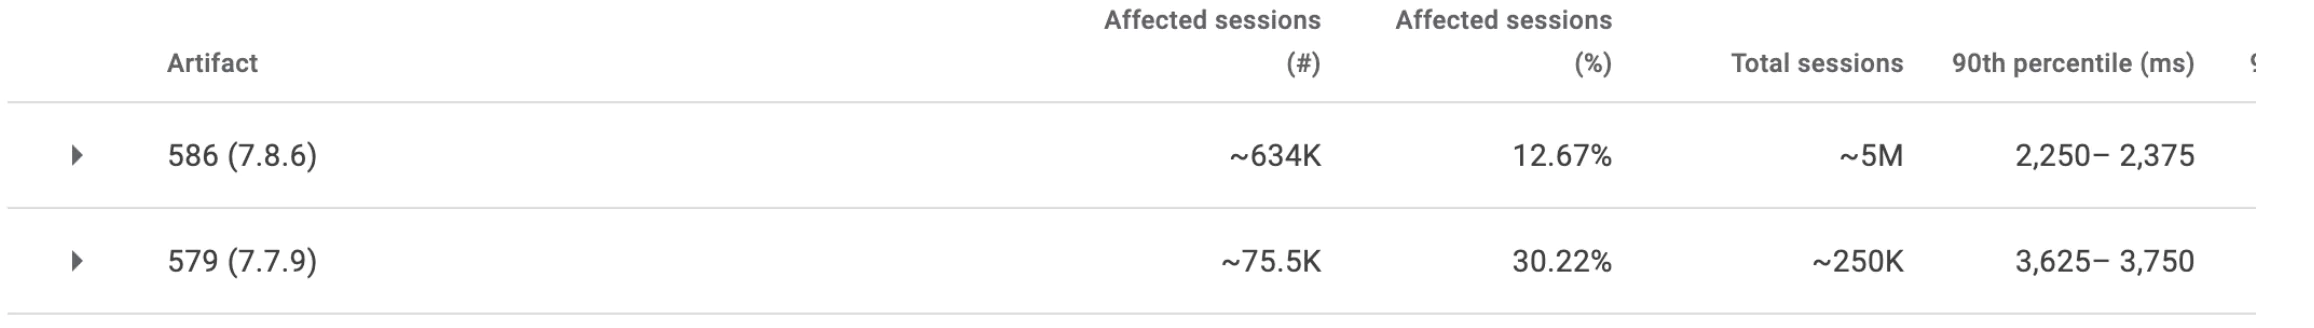
🚀 From 7.7.9 to 7.8.6, but this wasn’t just a version bump —
We quietly dropped a gold mine in 7.8.2 (Beta), and the numbers started falling (in the best way possible).
The full breakdown of how we achieved this is waiting for you at the end. But not just yet — because before we reveal the full vault, we want to walk you through each nugget we uncovered, each tunnel we dug, and every ounce of gold we pulled from this mine. Stick with us — the real treasure is in the details.

What We’ll Unearth in This Gold Mine -
- Async Nav Graph Inflation
- Prefetch dependencies in background thread by hilt in parallel to view inflation
- Initialize Ktor Request headers only while initialization
- Understanding Janks better
- Deep diving on CPU Contention - Arm Cortex A53 Cpu’s and more
- Lesser dex leads to lesser disk reads
- Leveraging Baseline profiles at best
⛏️ Striking Gold with Async NavGraph Inflation
What Slowed Us Down
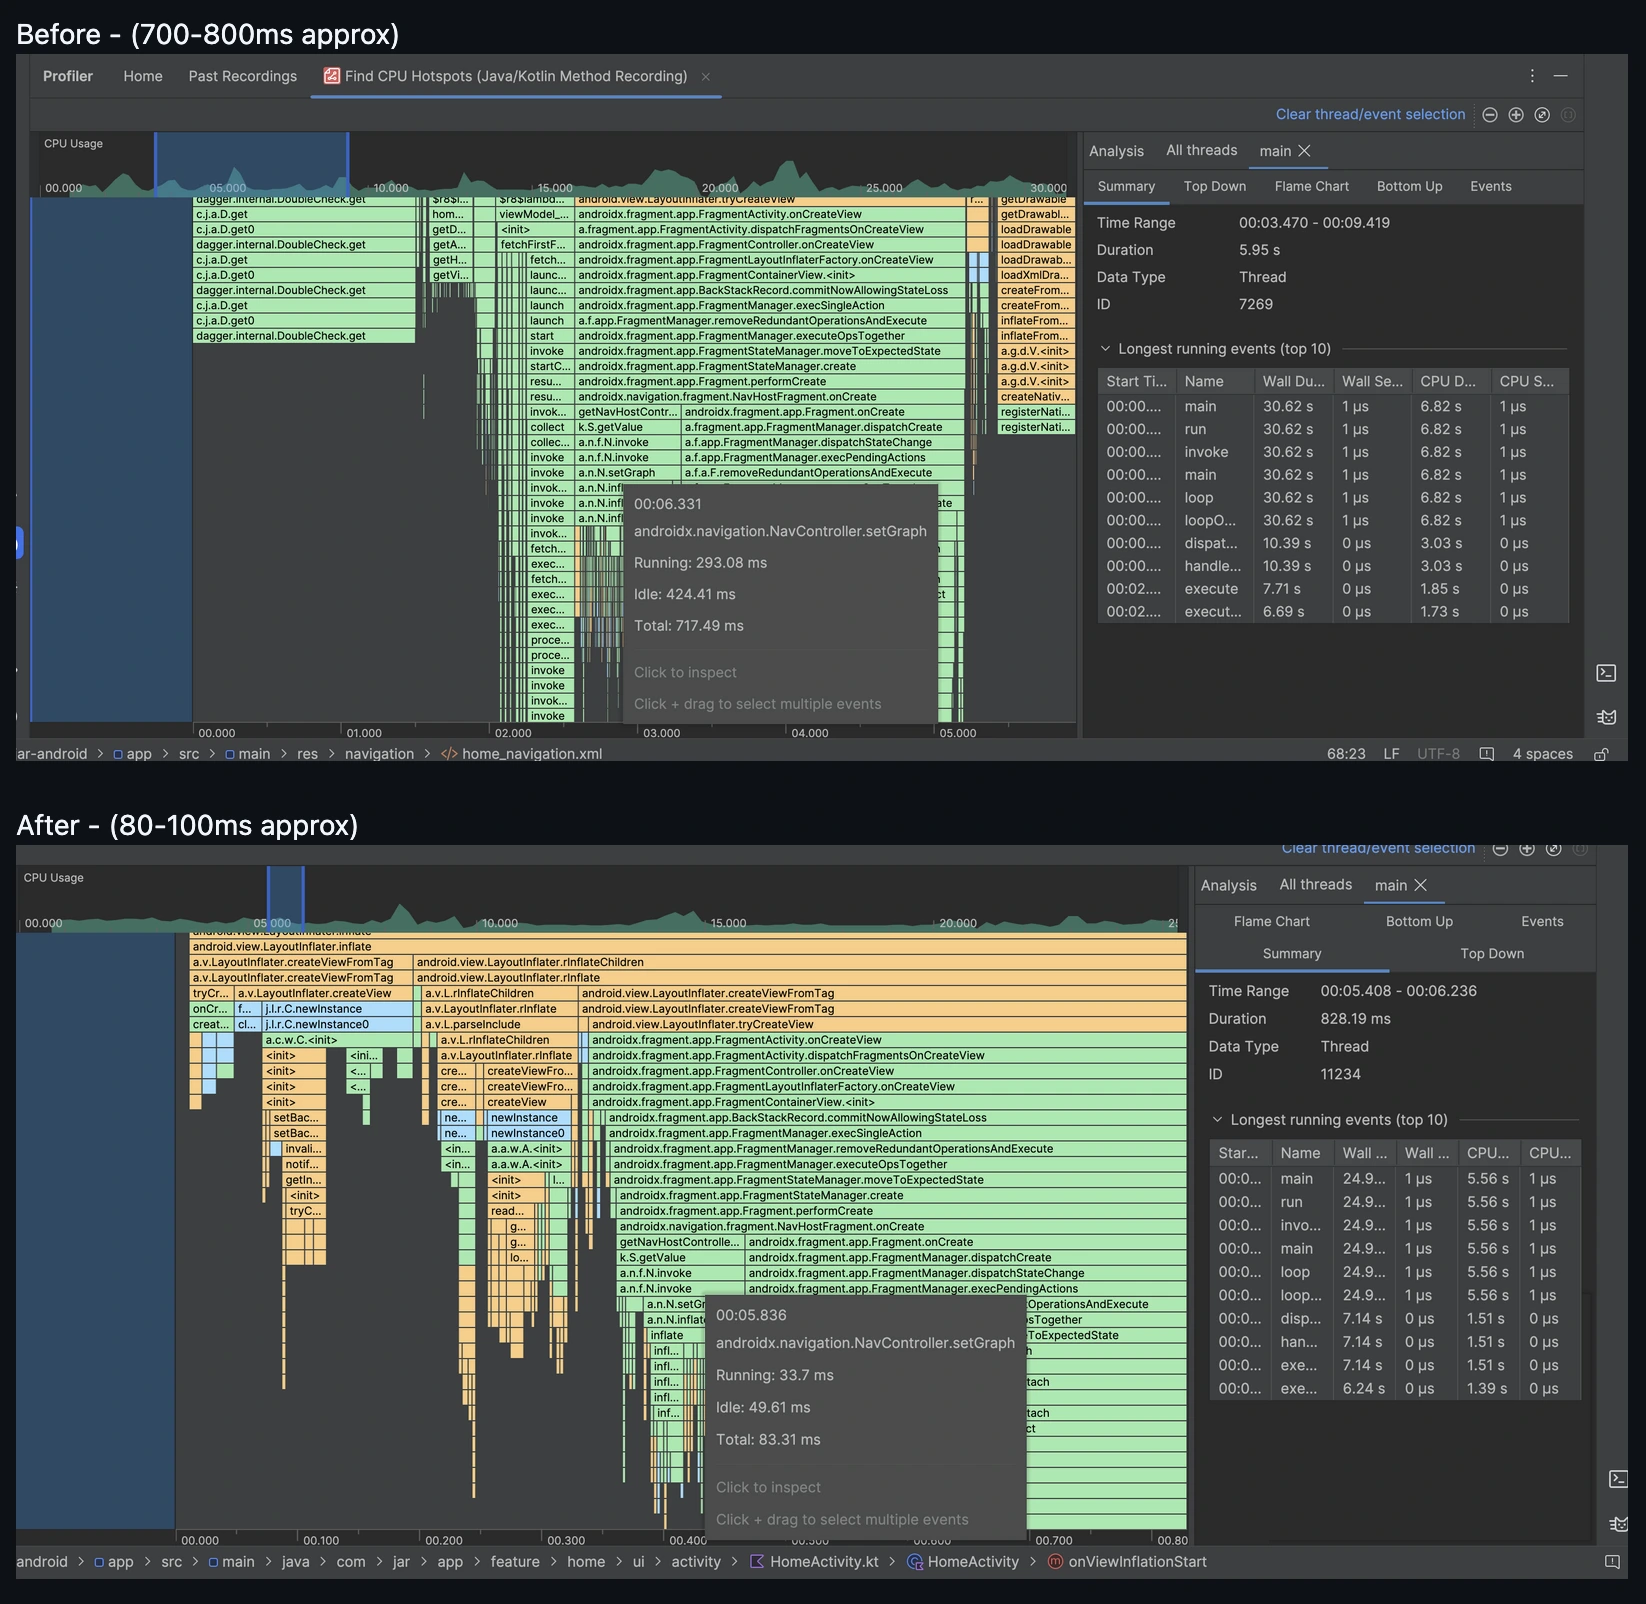
Generally we all are inflating our nested navigation graphs in the main thread using the include attribute in home_navigation. This invokes the inflate method for each included navigation graph during the launcher activity's inflation. This results in a blocking operation during activity inflation, which is part of the startup flow. The setGraph method of home_navigation takes 700-800ms, mainly due to multiple inflate method calls.
The Pickaxe we used
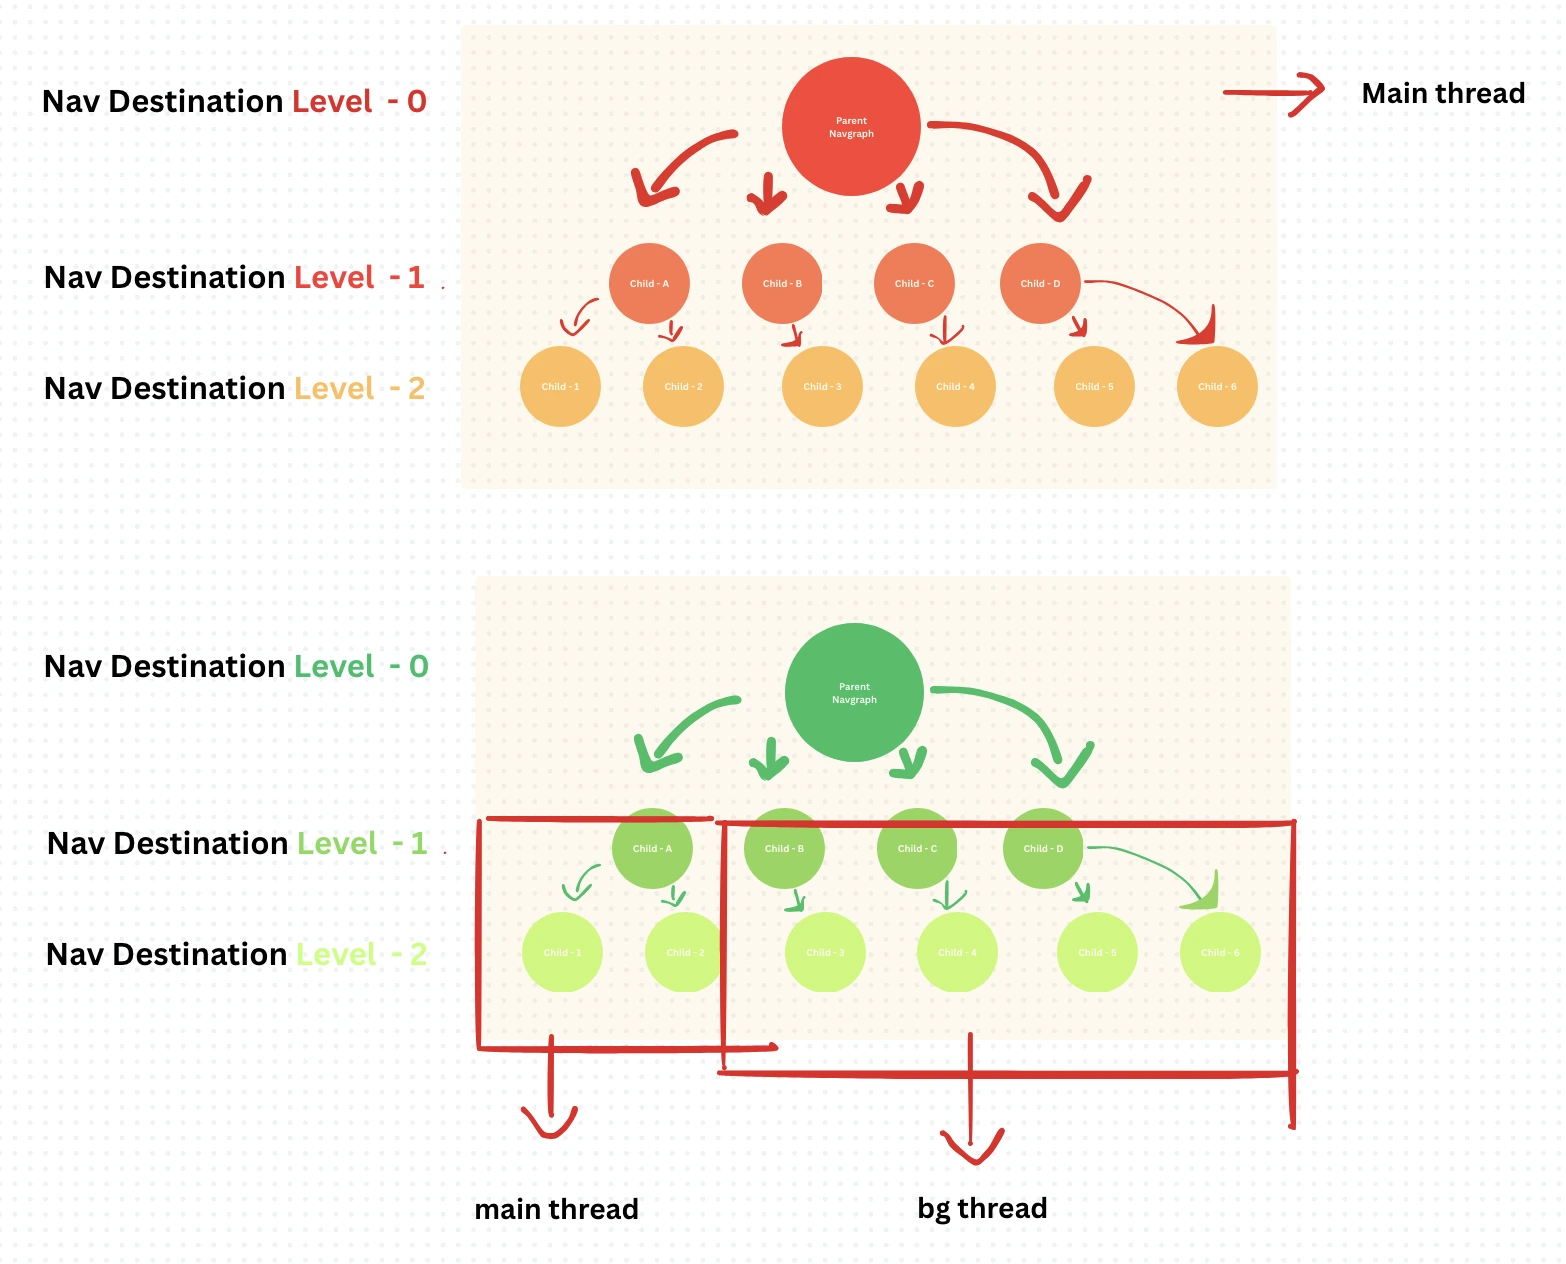
We proposed and implemented a strategy to inflate and insert all nested graphs in the background thread during activity setup — before the user sees any UI.
Understanding API Methods Exposed by NavGraph
Inflating a Navigation Graph dynamically:
val newGraph = navInflater.inflate(R.navigation.buy_gold_nav_graph)
Adding Nav Graph Dynamically
navController.graph.addAll(newGraph)
This breaks down the NavGraph into separate NavDestination instances and adds them to the actual main navigation graph.
Example: If BuyGoldNavGraph has 3 fragments, BuyGoldNavGraph consists of 3 NavDestinations. These are then inserted separately into the main nav graph.
Adding a Graph as whole
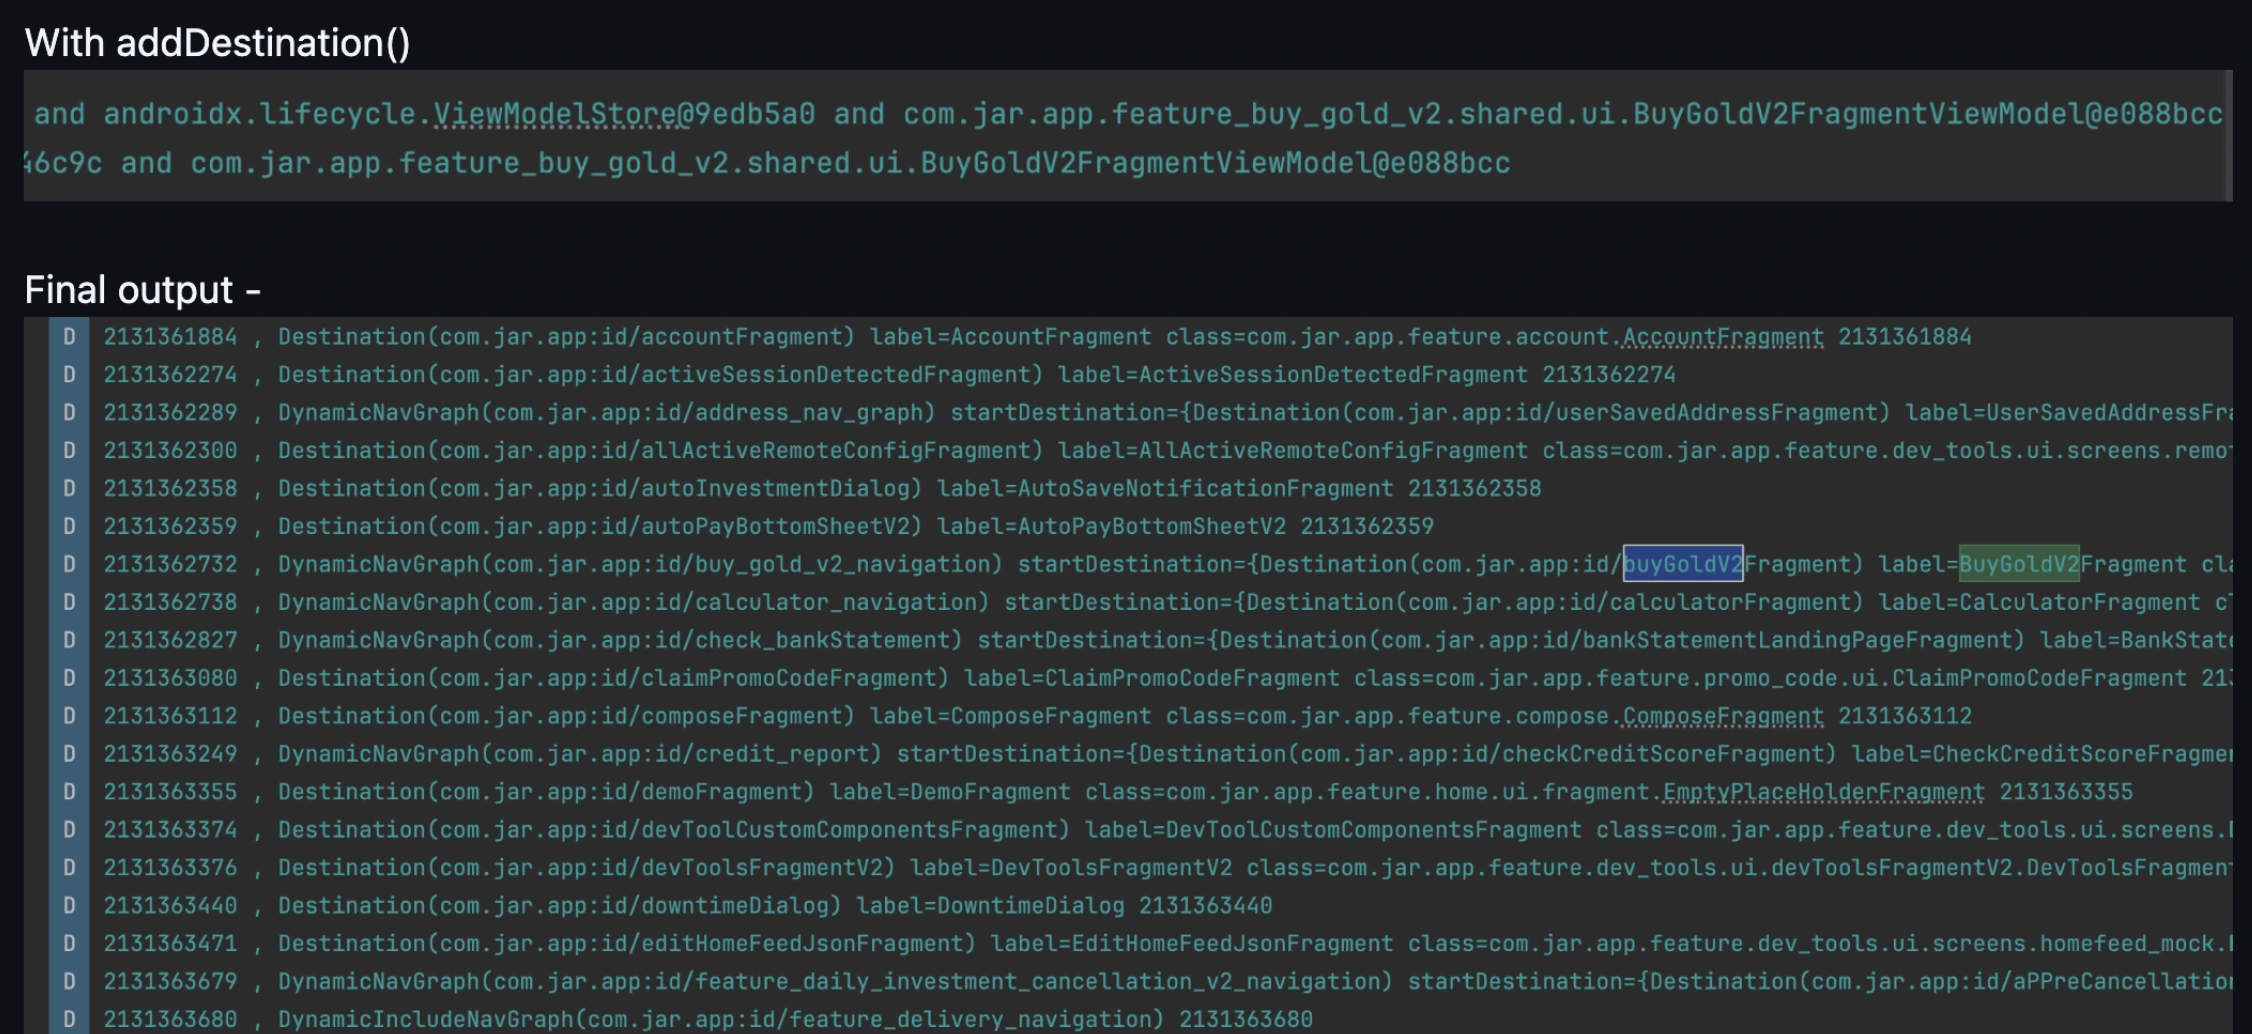
navController.graph.addDestination(newGraph)
This directly inserts the NavGraph into the nodes of the main navigation graph.
ANavDestinationis a single screen or part of your app in the navigation graph, like a fragment or dialog. Each destination is linked to aNavigatorthat handles how to get there. Even the navigation graph itself is treated as a destination.
Consideration for NavGraph-Scoped ViewModels
If we are using a ViewModel scoped to a NavGraphViewModel, we need the corresponding nav graph to exist as a whole inside the nodes.
Using addAll() breaks down the nav graph into individual destinations, which removes its own individual back stack entry. In Layman terms all the nodes consists inside the NavGraph would be on same level and would act as NavDestination rather than going a level down of parent NavDestination (NavGraph)
This whole purpose of scoping viewmodel to navgraph gets break while initializing NavGraphViewModel as it requires a back stack entry of the module's nav graph, which will not be available.
Solution: Use addDestination() instead, ensuring the entire nav graph remains intact. Means this pushes a whole node of Nav Graph as Nav Destination and then it would have different nodes like Fragments as Nav Destinations.
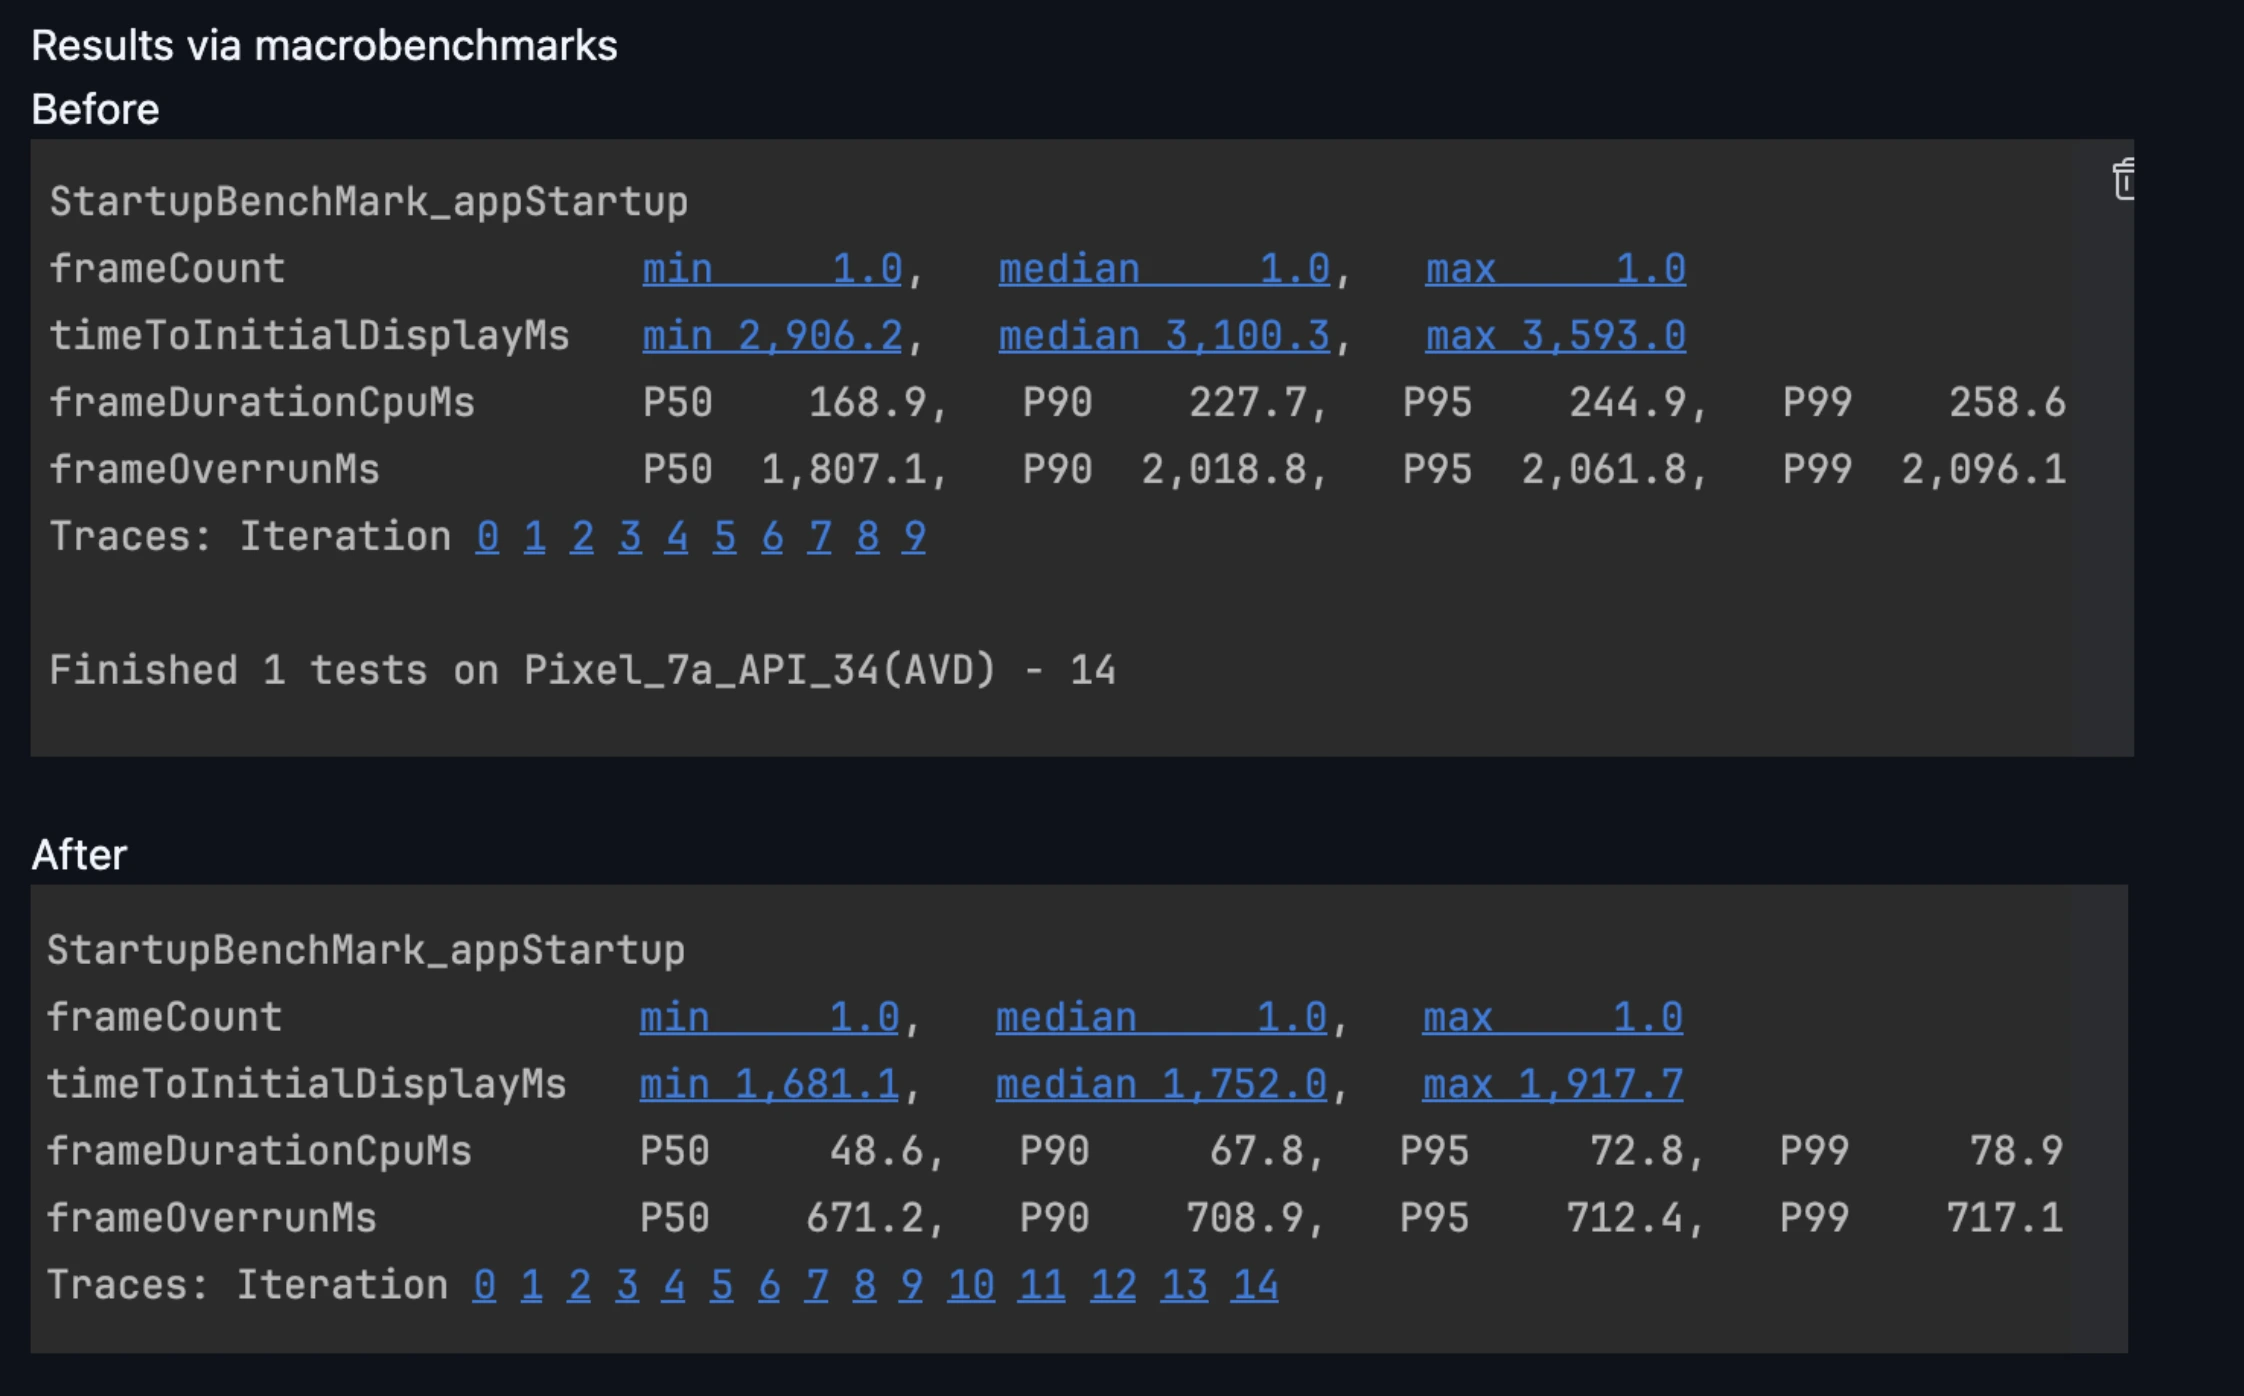
Final Results
Reduced setGraph trace to 50-70ms which was 500-700ms before.
⛏️ Prefetching Hilt Dependencies in Parallel
Insight we found -
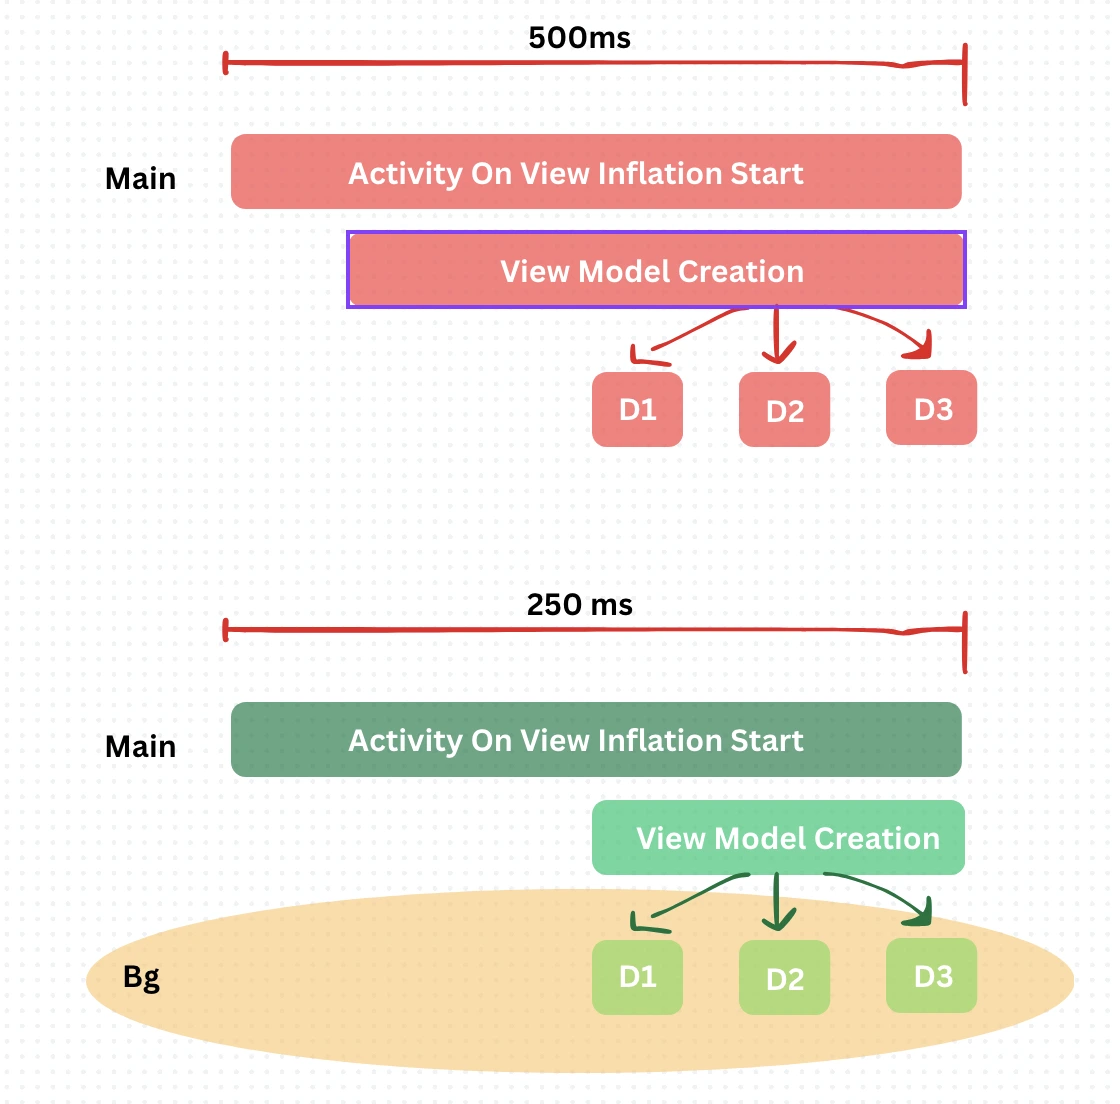
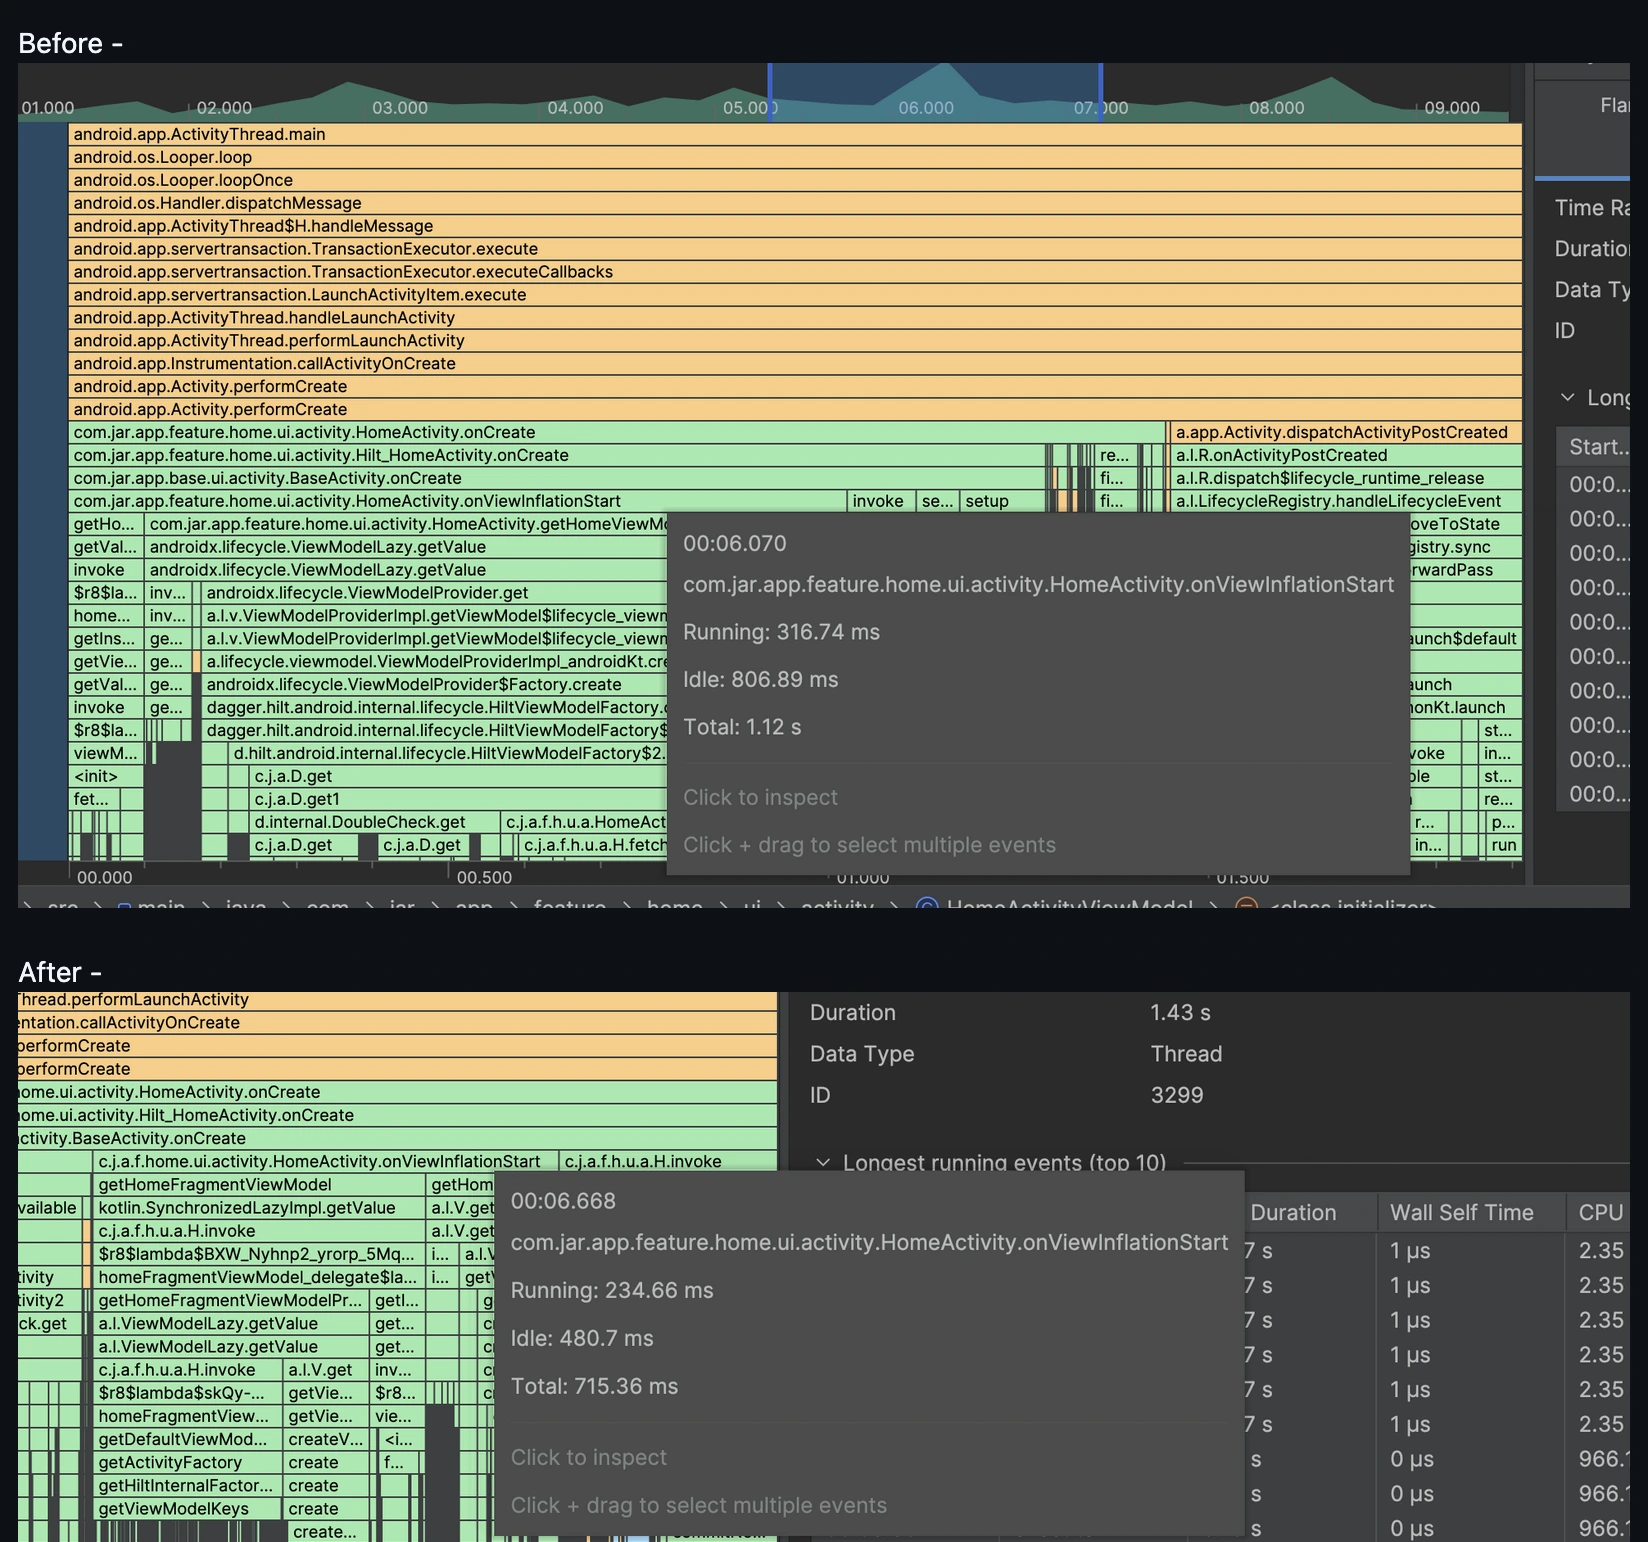
OnCreate Callback trace takes significant amount of CPU Resources. For lower end devices it goes upto 2-3s (eg. Redmi A3, 4gb RAM) for debuggable builds. We have noticed significant time being taken by view model creation in Home Activity.
In a Kotlin Multiplatform project like ours, shared ViewModel classes often depend on injected services like analytics, repositories, and config APIs.
While @Inject + constructor injection is clean and testable, it becomes a performance bottleneck when:
All dependencies are initialized on the main thread.
The constructor gets too heavy.
ViewModel creation stalls UI thread during cold starts or first-fragment navigation.
Hilt Injections takes 30% time almost as overhead for our core View Model creation.
Solution -
We introduced a wrapper called CommonLazy, with platform-specific actual implementations.
CommonLazy - An expect class we have which has an actual implementation in Android with Dagger Lazy.
class CommonLazyAndroid @Inject constructor(
private val lazy: dagger.Lazy
) : CommonLazy {
override fun get(): T = lazy.get()
}
We have wrapped all our constructor injections with CommonLazy for shared View Model and then we have invoked them manually as soon as the view model starts initializing with a separate preFetchJob which gets cancelled during the termination of OnCreate callback of Launcher Activity.
The idea is to let the injections get their implementations in default dispatcher until inflation is being done by Main.
This reduces the viewmodel creation trace by 30%.
⛏️ Initialize Ktor Request headers only while initialization
The Problem
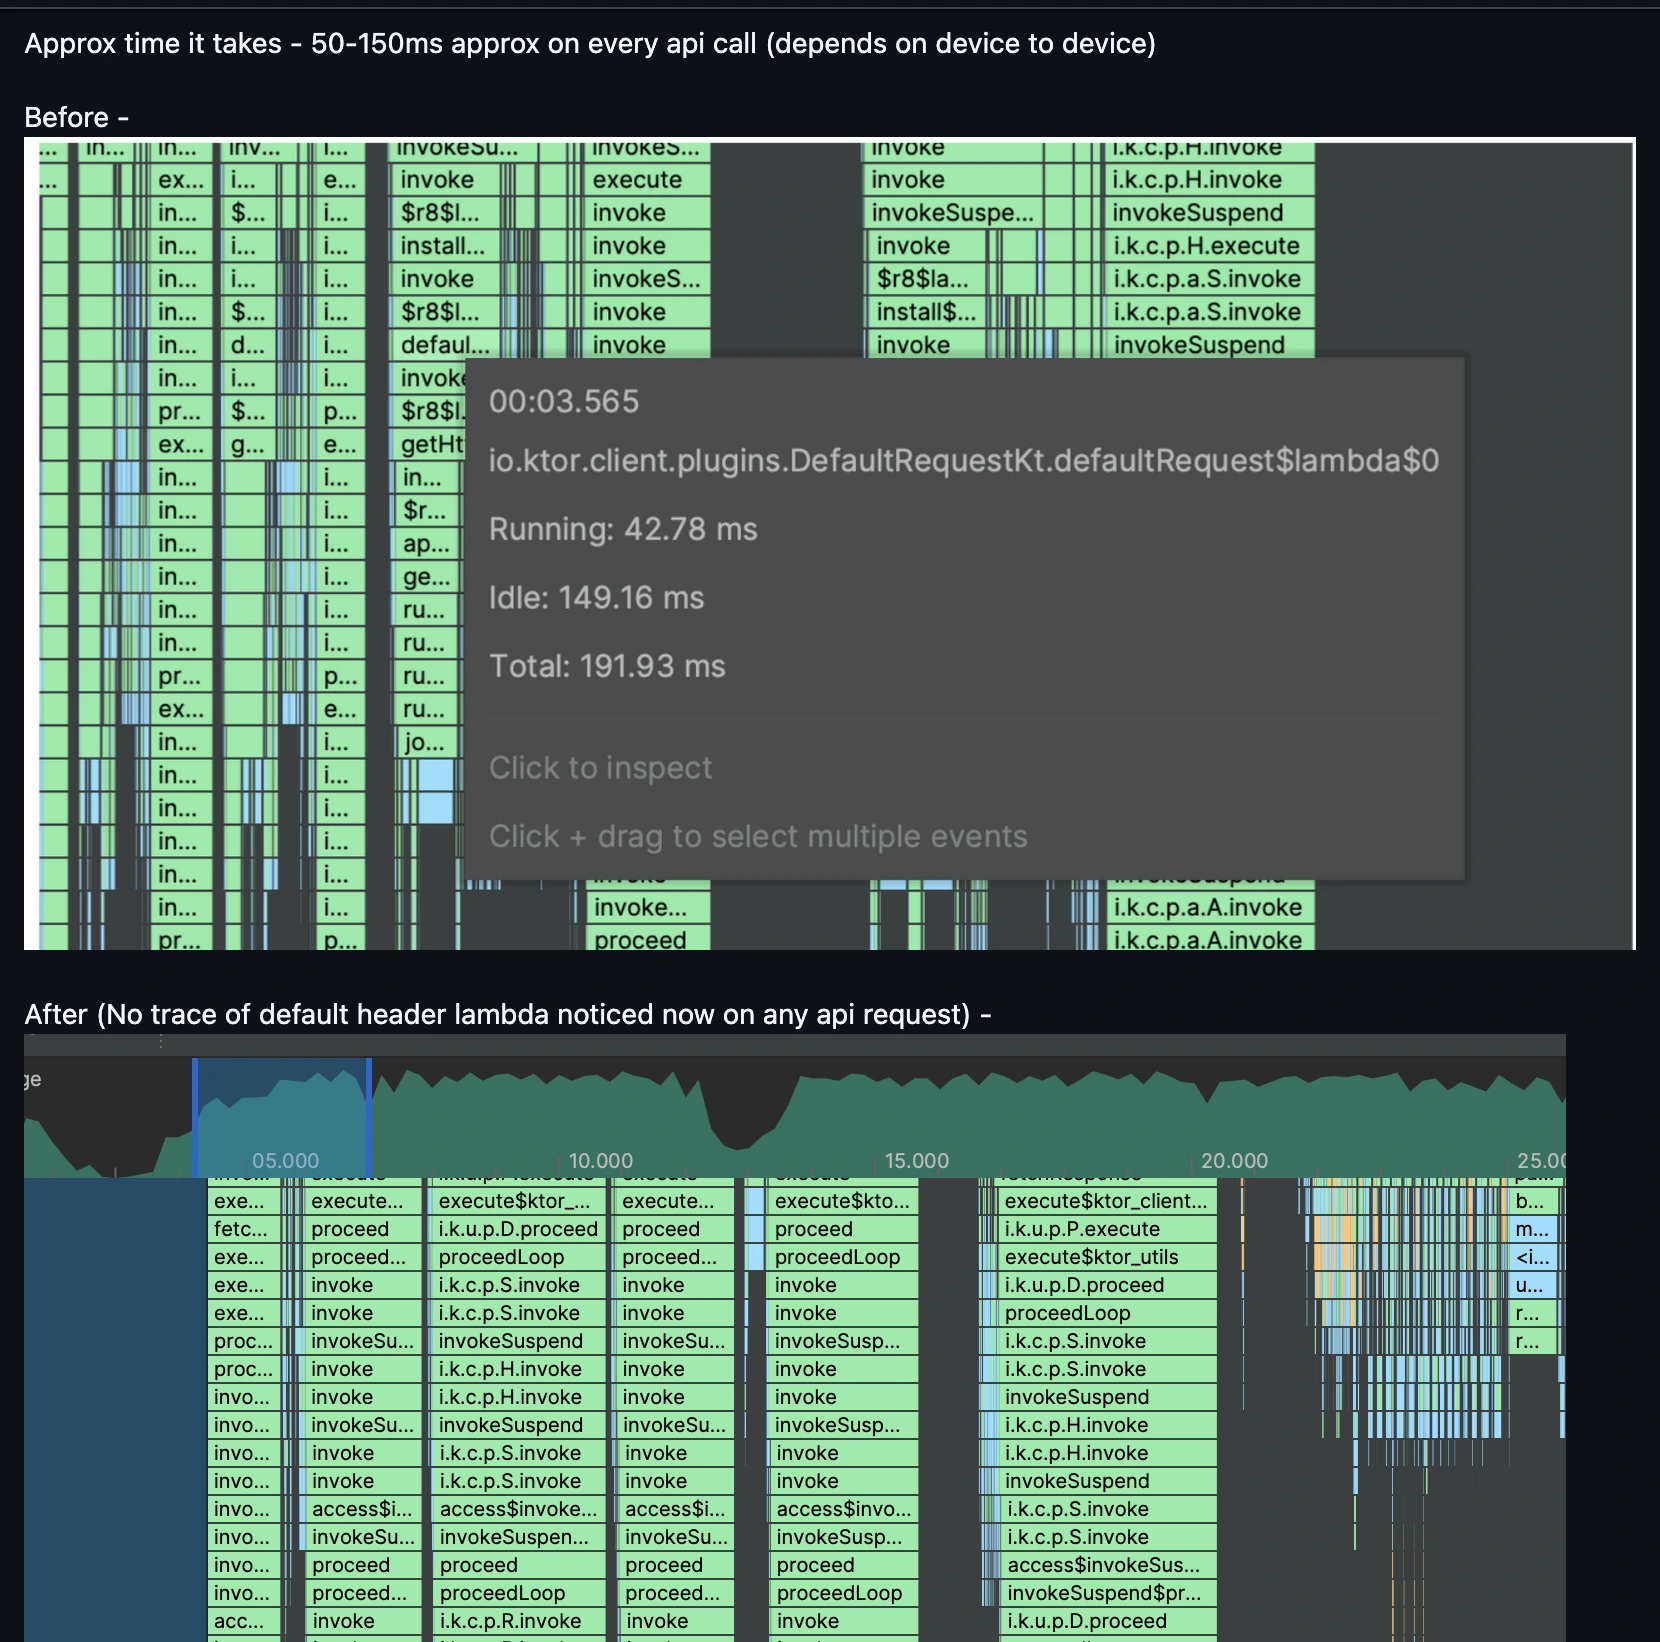
In our Ktor client setup, we were using a defaultRequest lambda to set headers on every API request.
Inside this lambda, we invoked another lambda (defaultRequestHeaders) to fetch the latest header map dynamically.
This led to: A fresh lambda evaluation for every network call
50–150ms overhead per request (varied by device and execution context)
Unnecessary allocations and performance cost, especially in high-traffic user sessions
Multiply this overhead by thousands of daily requests, and you’re looking at real CPU and power burn.
The Solution
We ditched the per-call lambda and instead shifted to a shared, mutable header map. The defaultRequestHeaders now simply returns a MutableMap<String, String>.
This map is initialized once and reused for all requests.
When any header needs to be updated (e.g., token refresh, locale change), the consumer updates the map directly.
The Result
50–150ms saved per API call, depending on device performance.
Zero GC churn from repeated lambda invocation or map re-creation.
Boosted consistency in high-frequency call stacks (like polling APIs, autocompletes, etc.)
🎢 Knowing What Jank Actually Is — A Journey from Views to Pixels
You hear it all the time: “Fix the jank.”
But what is jank, really? It’s not just dropped frames — it’s a breakdown in the synchronized dance between your CPU, GPU, and display.
To render a view on screen, Android first needs to convert your layout (XML or programmatic) into pixels. But that path involves multiple steps — and potential choke points.
The Process (And Where Jank Sneaks In)
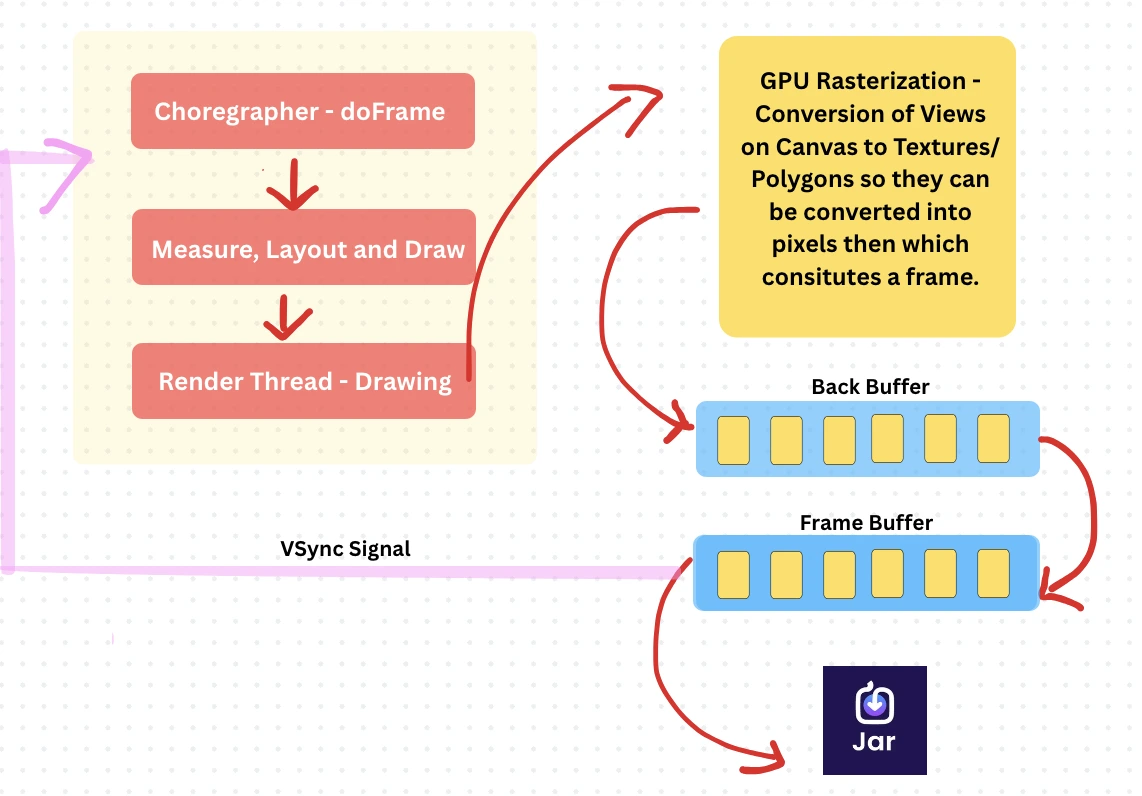
View to Polygon: Whether you define a layout via XML or code, it must be converted into polygons and textures — work done by the CPU using OpenGL|ES.
GPU Rasterization: The GPU takes these polygons and converts them into actual pixels — a process called rasterization.
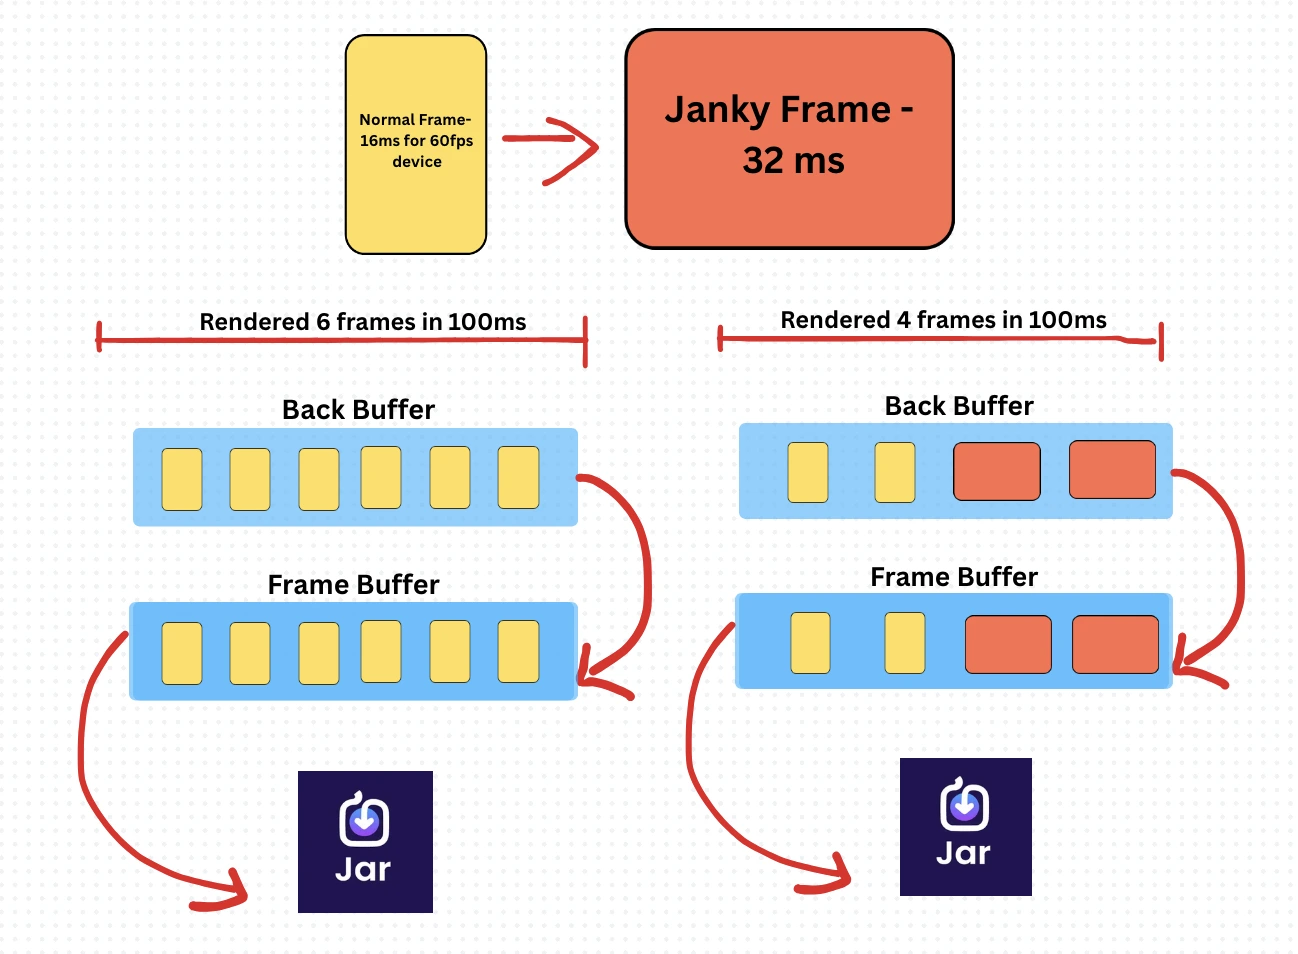
Double Buffering Magic: To avoid screen tearing, we use double buffering: GPU writes to the back buffer
Display reads from the frame buffer
Syncs only when the frame is complete — this is the famous VSYNC Signal.
Frame Rate vs Refresh Rate: Your screen refreshes 60 times per second (60Hz). If the GPU isn’t done by then, the display shows the old frame again
This causes lag or stutter — that’s the jank you feel
The Realization
Jank isn’t just “slowness” — it’s the GPU missing a deadline.
And every missed deadline means your user sees the same frame twice.
⛏️ Deep diving on CPU Contention - Arm Cortex A53 Cpu’s and more
Problem
We have seen straight janks in our Jar app’s release build with devices having the CPU of ArmCortex A-51. These janks result in UI lags and increasing our app startup traces also. As Firebase and Android Vitals both lead to capture only COLD Traces. Which means none of my process and activity would have been warmed up and requires full initialization from scratch.
Investigation methodology
We have run multiple macrobenchmarks tests on our release build which further generates system traces which produces information about all virtual threads with traces producing information about how android as a system reads our dex files, converts it oat files, Activity inflation (Start and Resume methods), Bind application (Content providers + Application class initialization) and Vsync to Choreographs signalling to produce frames. Then we have tried to analyze these traces in both Android Profiler and Perfetto. Hence Both methods have their own pros and cons. But still perfetto has a great win over Android Profiler when it comes to investigating things on a low level.
Investigation Findings
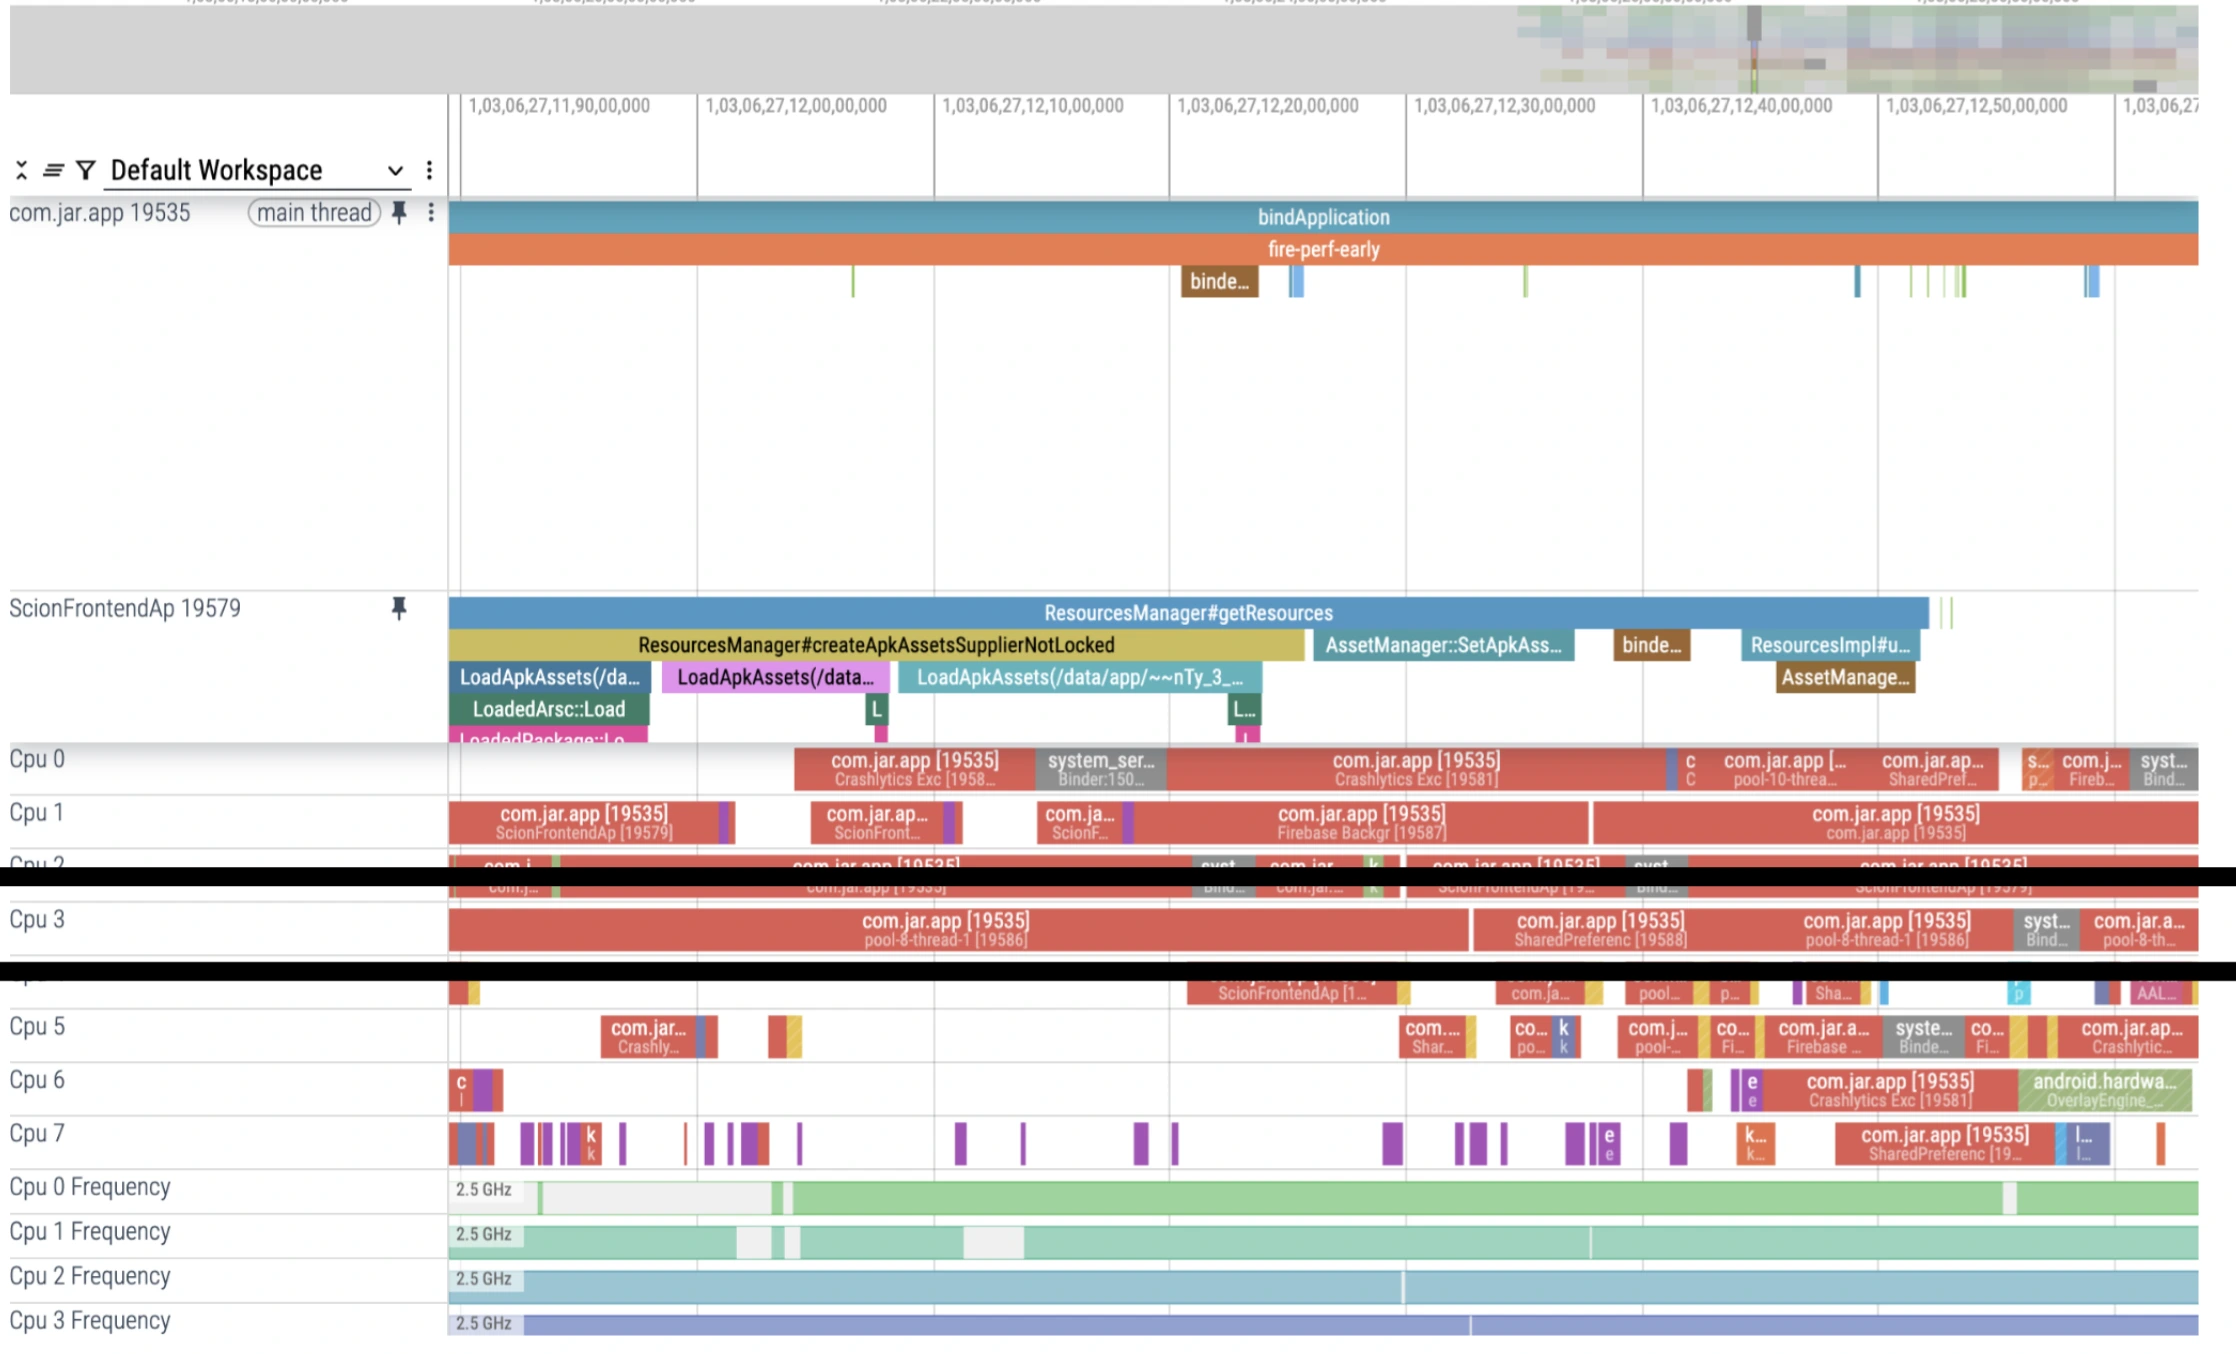
CPU Contention - Here multiple virtual threads fight for CPU so they can consume to execute their tasks. Generally when we are going for app startups we need to have a smooth CPU Contention so janks won't be produced much and it would avoid slutters with frozen frames also.
Reason of CPU Contention - Multiple Virtual threads of multiple processes fights for the CPU to execute their tasks. Every individual app forks the zygote process of android and starts as a whole new process which would have multiple virtual threads. For Jar App we generally have 200-220 virtual threads inside of our process [com.jar.app]. There can be cases where our background threads also run concurrently instead of parallely as we might have no cores left for our own virtual threads at a certain instant.
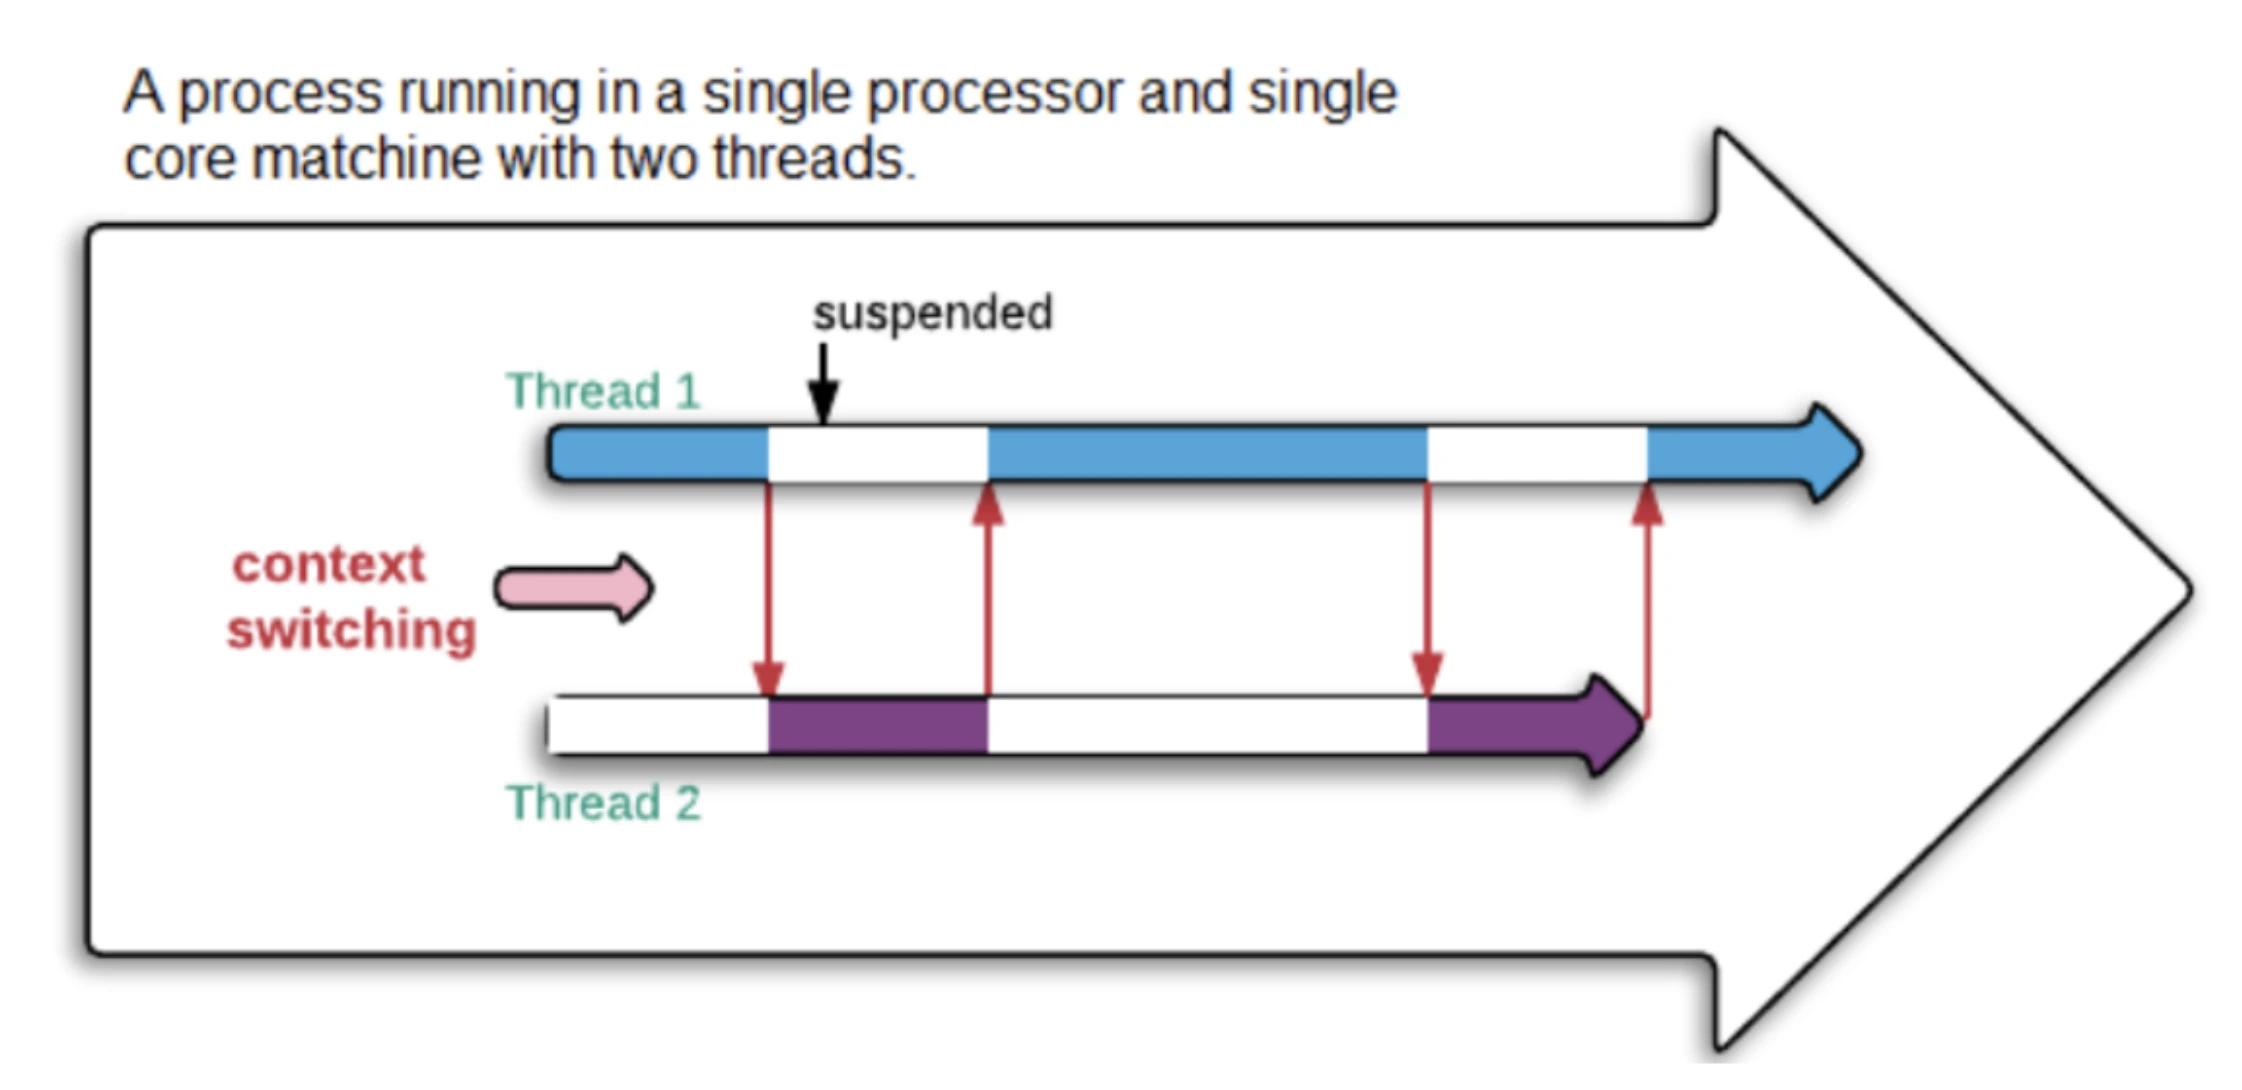
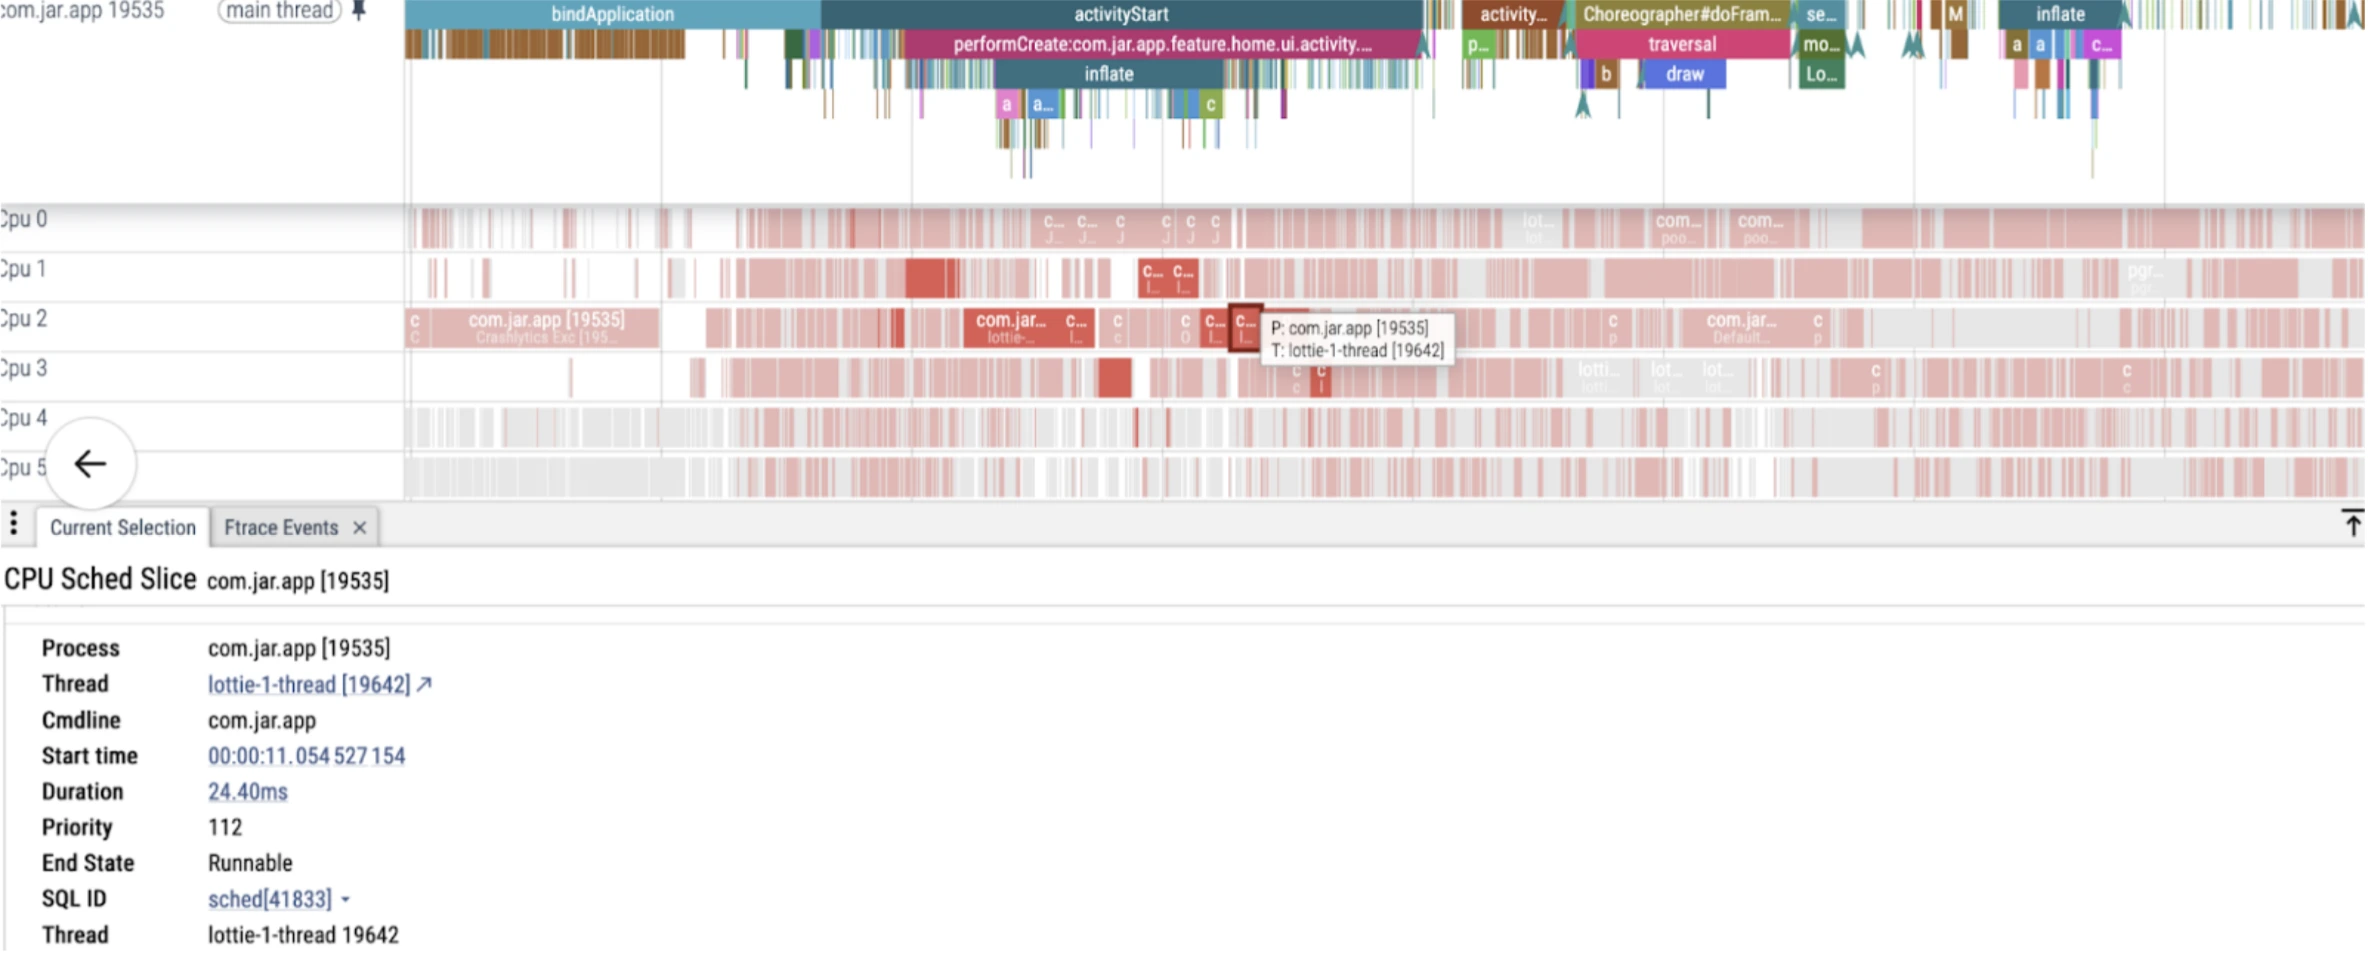
We might think that running tasks on a pool of background threads wont touch the main thread so yes this might look right in an ideal world but not actually when we try to see how things actually gets scheduled by Android OS Cpu. If the CPU Contention is high, which is generally the case if your app is burdened with a lot of third party libraries so you would see your main and background thread executing concurrently in a single core. This actually creates an illusion of parallelism which is actually a concurrency. This further leads the CPU to be consumed by other threads also which is a direct harm to your main. Though in many cases it can be false positive also where you might be executing any task in main and that requires a background thread to execute concurrently. But in our case this isn't ideal. As ScionFrontendAp has been sharing the core with main and they both are independent of each other. Same can be seen in Core-3 contain threads of process 19535 [JarApp]
Results found from our own app
Unwanted LottiePreparsing
Lottie Thread consuming CPU resources in various cores even when we don't require this anymore in PreParsing. Further it also makes the way clearer that pre parsing in startups can be an act of over engineering itself. As we were trying to preparse lottie in one of our older versions to reduce overhead in loading the lottie but in lower level it actually creates more janks.
Pre parsing of actual asset of lottie can be seen in Ftraces.
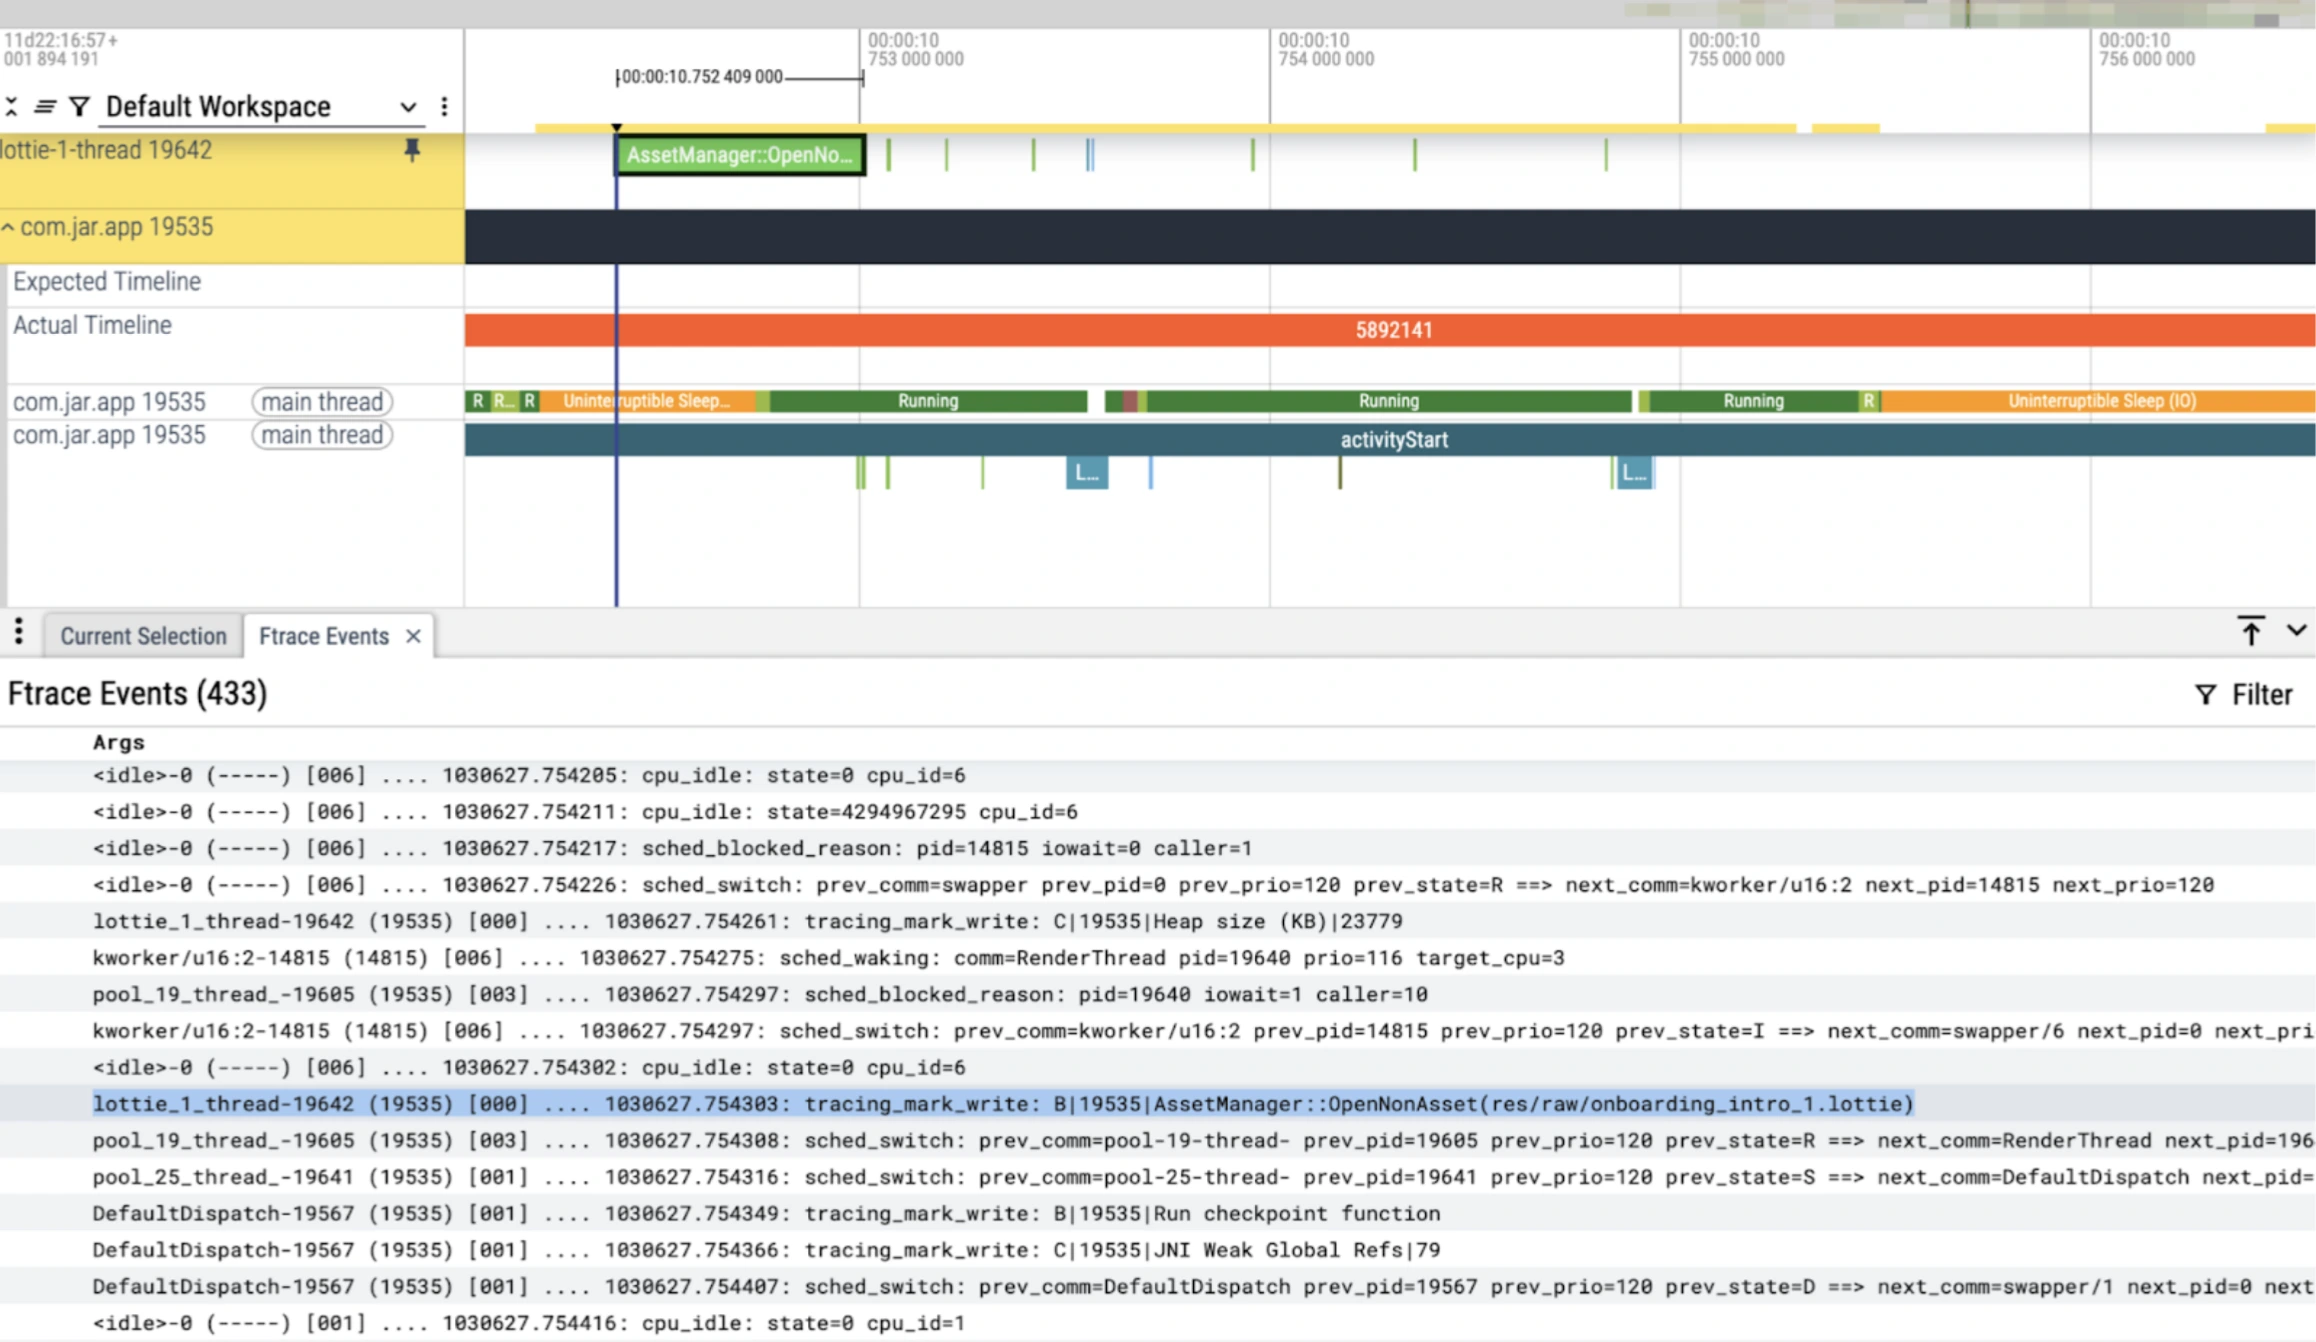
Lottie thread’s high CPU consumption can be found when Choregrapher has invoked the doframe method for frame rendering.
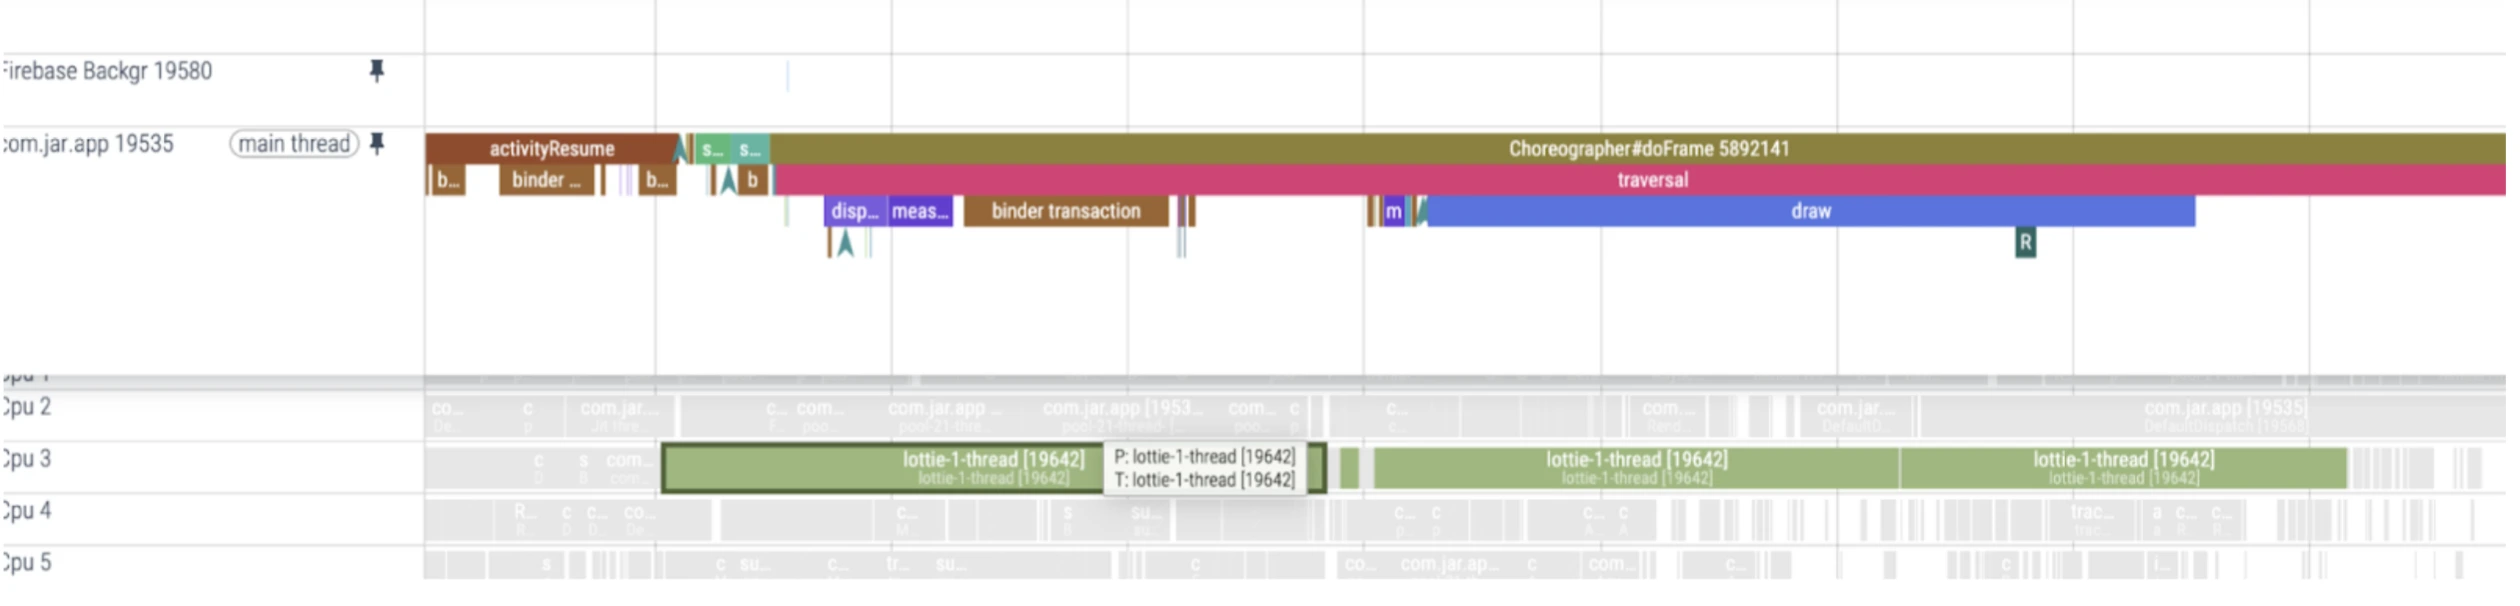
Consuming Core 1,2 and 3 with app process tasks
FTraces insights -
Ftrace events help trace how threads are scheduled and interact during execution. sched_wakeup marks a thread being made ready to run, while sched_switch shows an actual context switch between threads—useful for detecting when the main thread is preempted. binder_transaction and binder_transaction_received capture inter-process communication (IPC) events via Binder, often triggered by system services or libraries like Firebase.Events like am_proc_start, am_proc_bound, and am_activity_launch_time help map the app startup sequence. Analyzing these together reveals performance bottlenecks, thread contention, and sources of jank.
Results after removing lottie preparser
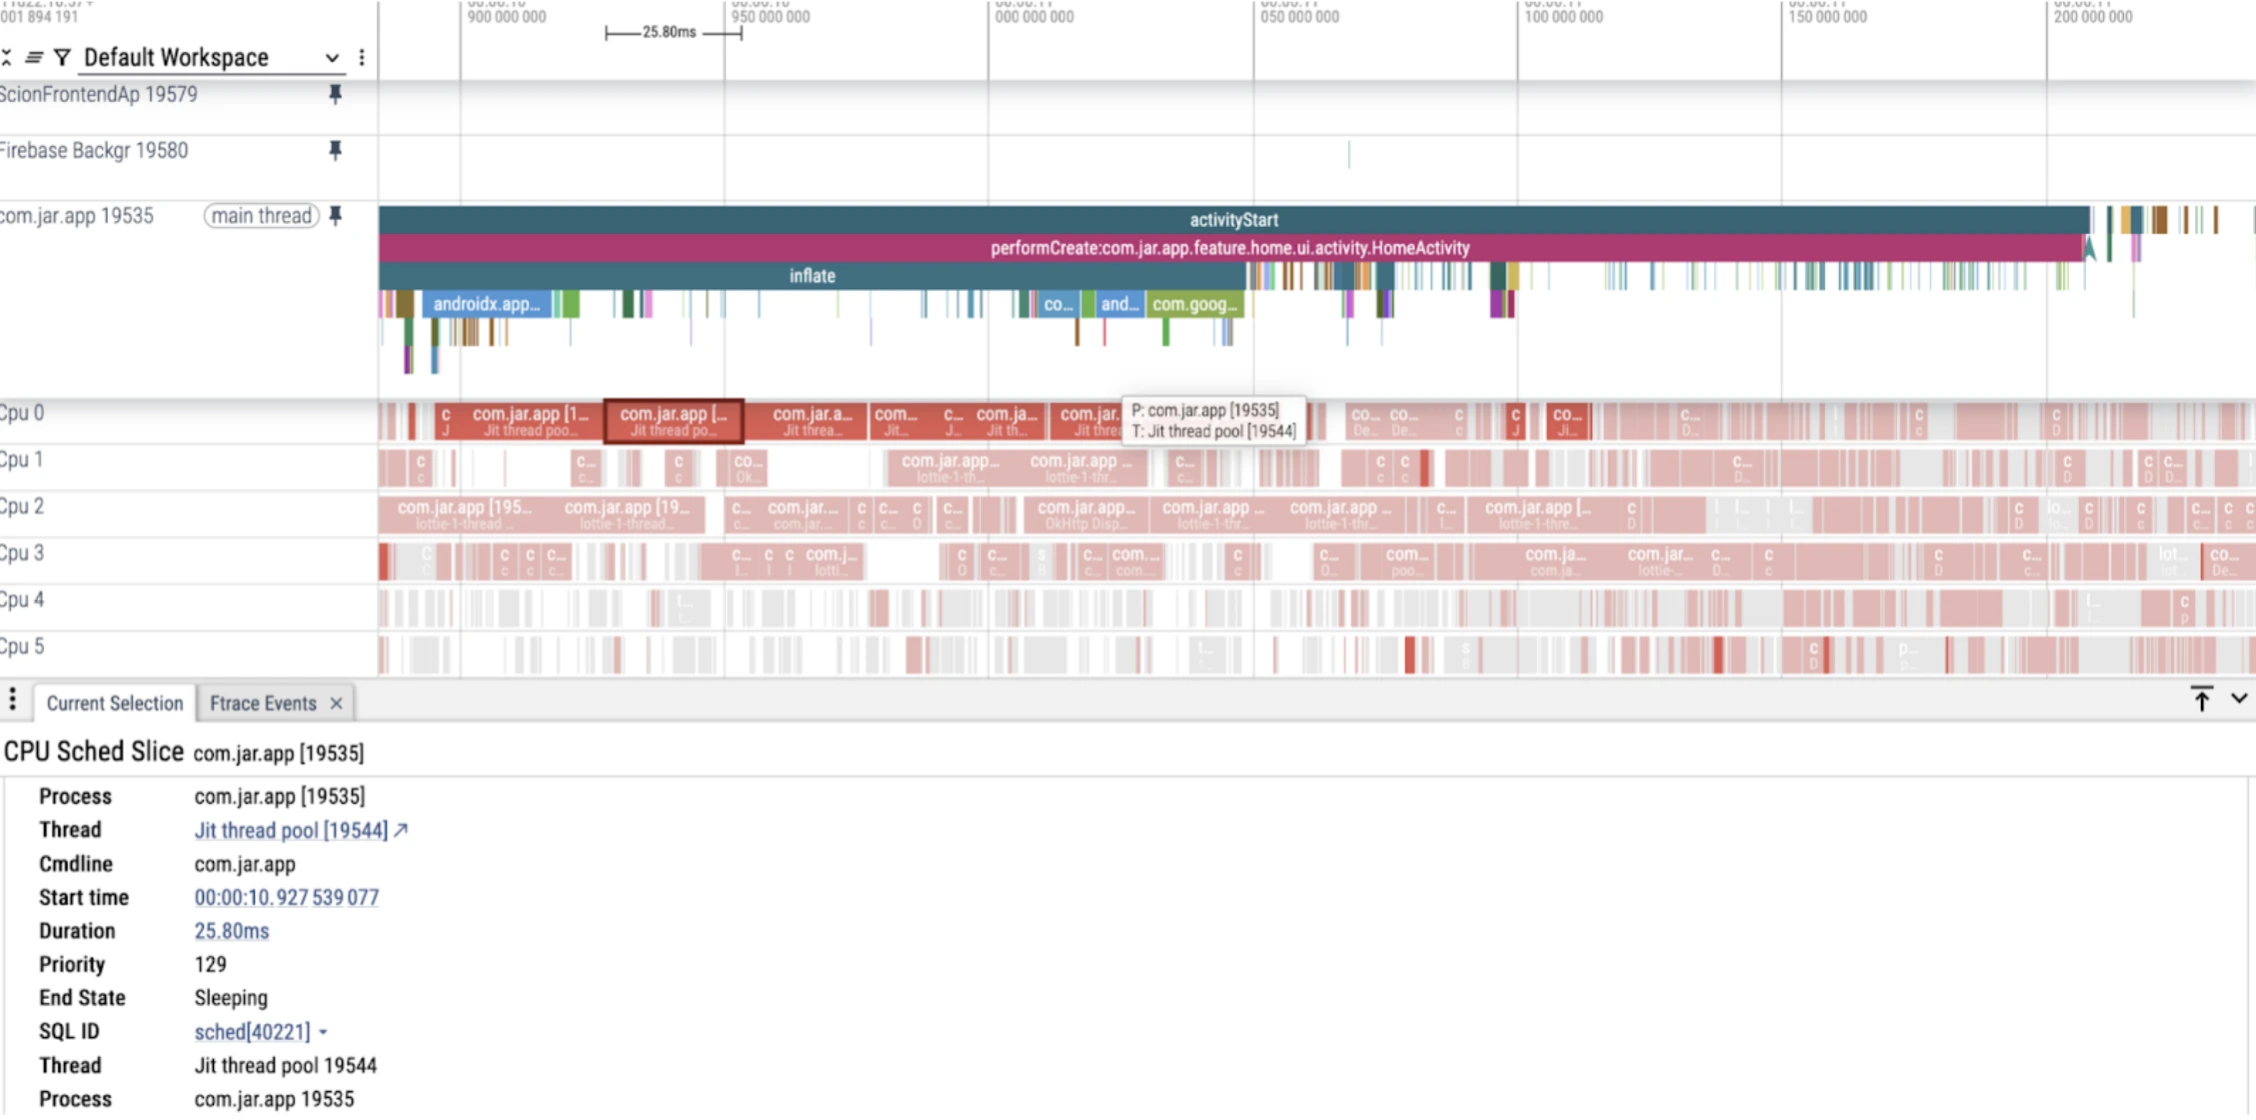
JIT Thread Pool Congestion
Android Runtime consists of both AOT and JIT. Both have their own roles and responsibilities. But in startup its usually suitable to precompile the majority of your flow so it can be accessed by AOT instead JIT child counts would be lower and there would be less congestion in JIT. Increase in JIT child counts -> JIT Thread Congestion -> JIT is running actively to compile methods and classes so next time those recorded classes and methods should hit JIT Cache for smooth rendering.
In our case we have seen a few methods compiled by JIT of Lottie parser (could be because of that pre parsing of lottie in startup, that has been removed now) and some reflection methods.
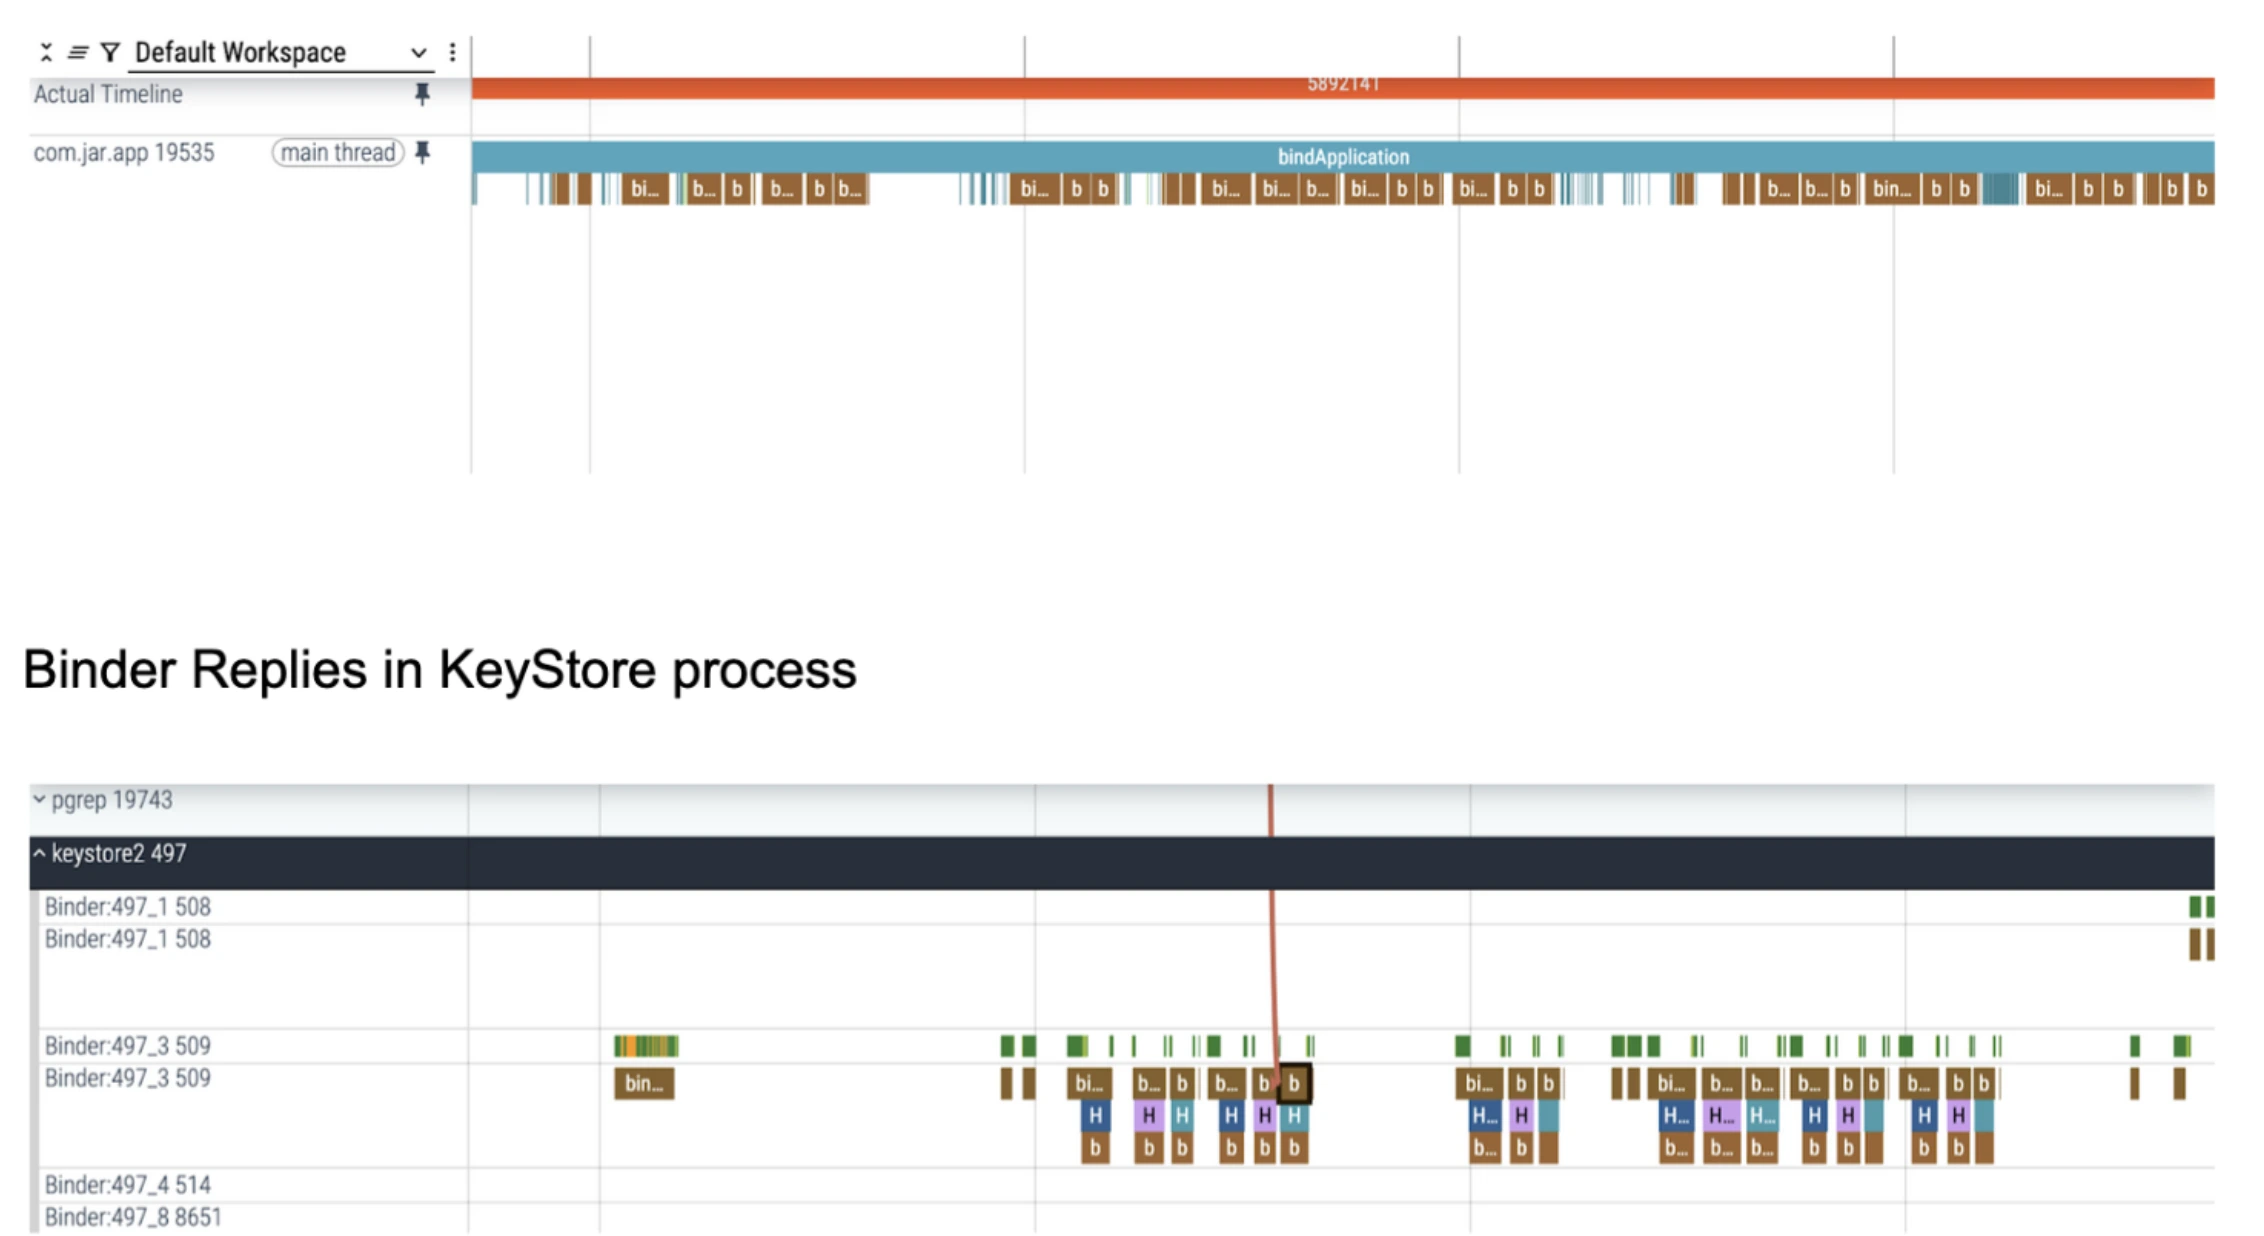
Unwanted Binder Transactions
Binder transactions are the core mechanism through which Inter-Process Communication (IPC) happens in Android. Same can be seen in our Main during bindApplication it tries to invoke a lot of binder transactions and all are being processed to establish communication with binder threads of AndroidKeyStore as we use encyrptedsharedprefs in startup.
But we couldn't do anything here as we require secured preferences to be initialized in our startup.
⛏️ Lesser dex leads to lesser disk reads — Shrinking for Speed
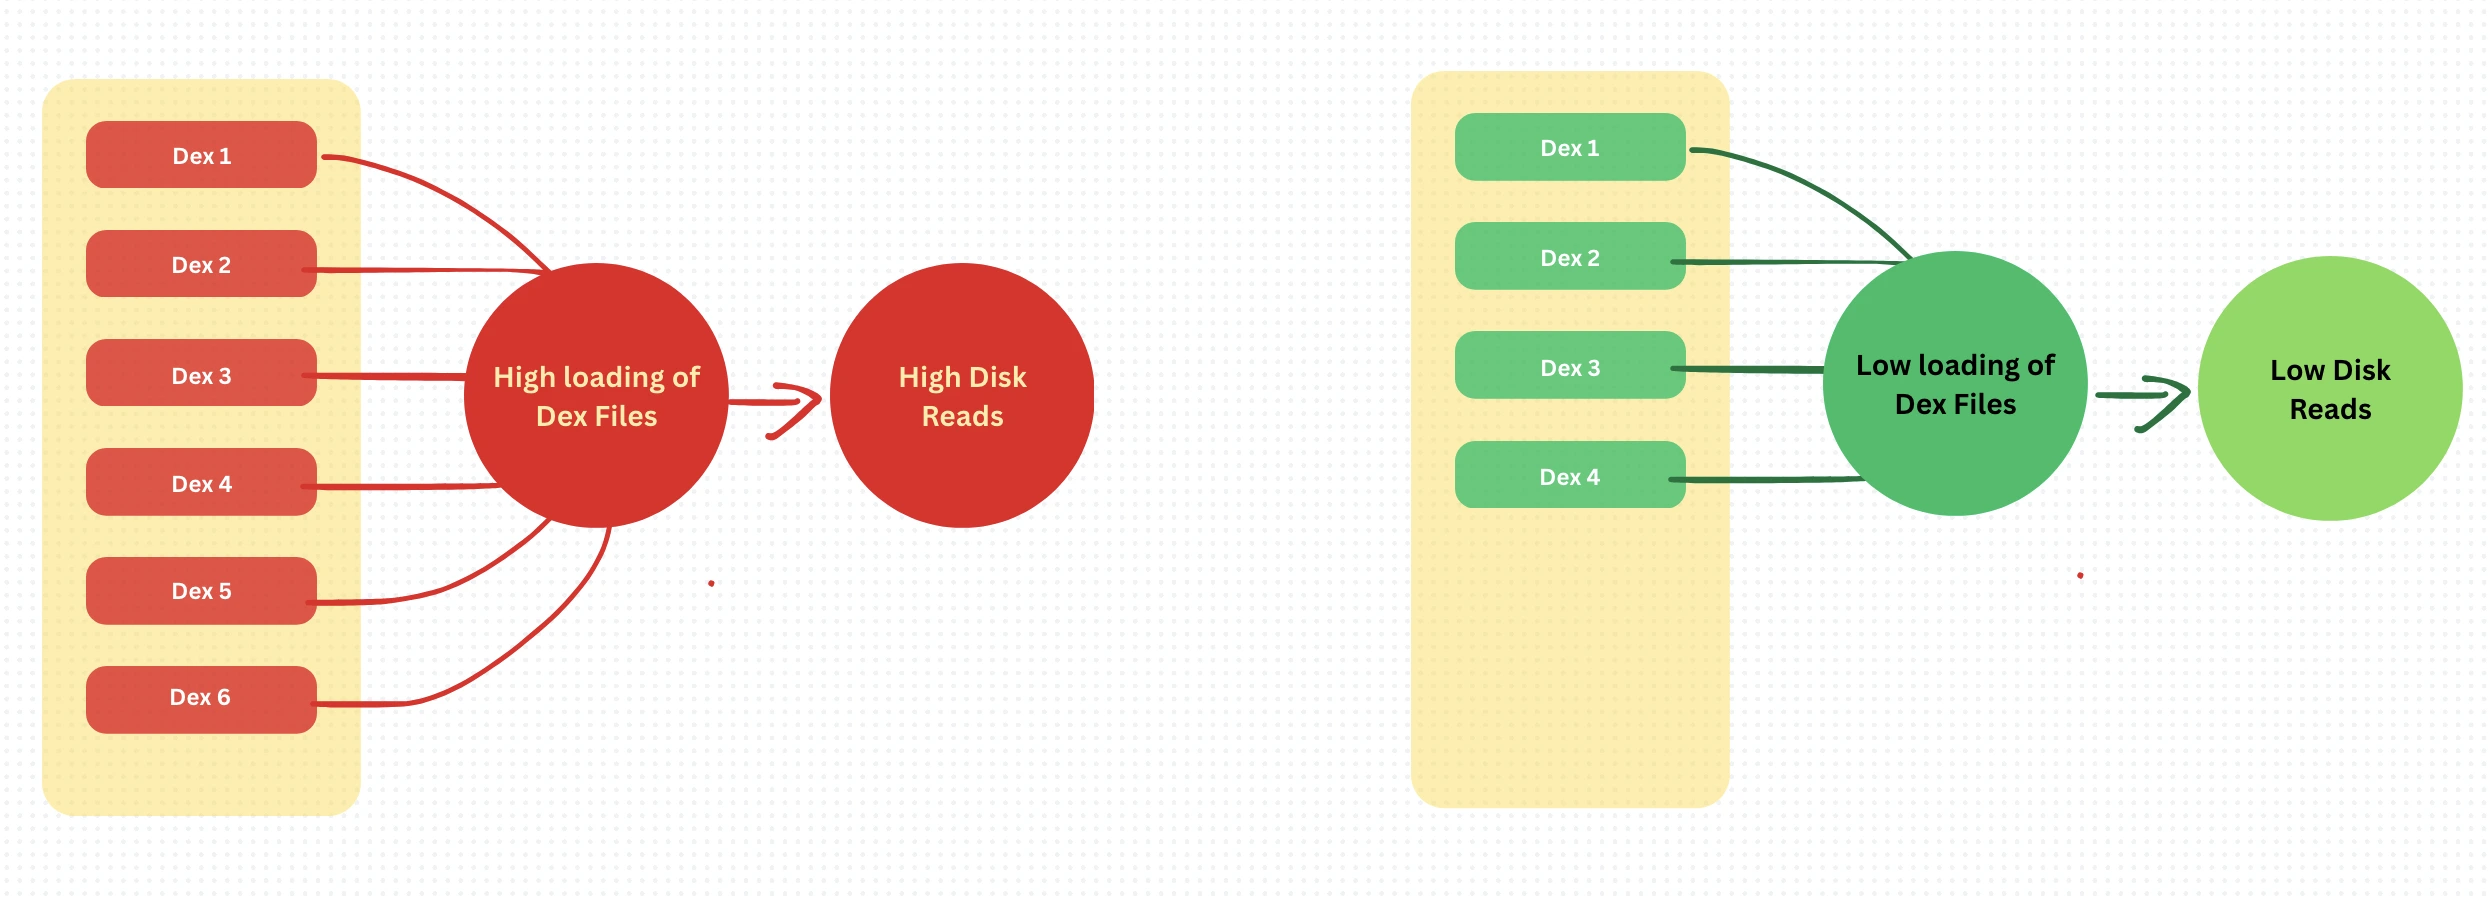
App size reduction is often seen as a distribution or storage concern, but it has a direct and significant impact on runtime performance — especially during cold starts. In earlier builds of the Jar app, our APK had ballooned to around 50MB, bundled with large assets, multiple DEX files, and monolithic feature sets. This translated into longer disk reads, slower class loading, and heavier verification work by the ART runtime every time the app started from a cold state.
To address this, we undertook a series of focused optimizations aimed not just at reducing the APK footprint, but also improving the app’s startup behavior. We refined our Proguard and R8 rules to aggressively strip unused classes and libraries, eliminated redundant keep rules, and restructured our modules to reduce tight coupling. Large and infrequently used assets were compressed or removed, and dynamic feature modules were introduced to offload non-critical flows such as onboarding, referrals, and support screens. By modularizing the app and minimizing what's shipped with the base APK, we ensured that only what’s absolutely essential is loaded during startup.
The result of these efforts was significant — our APK size dropped from 50MB to 25MB. With fewer DEX files to load and fewer assets to decode, the system spent less time on disk I/O and initialization tasks. This led to a measurable improvement in cold startup performance across all device tiers, with particularly noticeable gains on low-end phones that struggle with storage throughput.
We would be pushing our secret mining of app size reduction blog separately very soon. Hence stay tuned with us.
⛏️ Leveraging Baseline Profiles at Their Best
Baseline Profiles have become one of the most effective tools to optimize app startup time on Android — but only when implemented thoughtfully. While many apps benefit from generating a single profile to optimize their cold start, Jar’s app complexity meant we had to go a step further. With multiple entry points — such as onboarding, home screen, and direct deep links — relying on a single baseline profile wasn’t enough. If a profile only captured one flow, other critical paths would miss out on the performance gains entirely.
To truly leverage baseline profiles at scale, we ensured that each major startup path had its own profile generation coverage. This meant simulating real-world user behavior across different flows, capturing profile traces for each, and combining them during build time. Only then could ART precompile all relevant classes and methods ahead of time — no matter how the user entered the app.
Another key realization was the impact of stale or outdated profiles. If baseline profiles weren’t updated alongside changes in code structure or dependencies, performance would regress. In fact, in some cases, stale profiles led to cold start drops comparable to having no profile at all. So, maintaining them became a continuous practice — not a one-time setup.
🏁 Final Notes — From Traces to Treasure

Our journey to optimize Jar's app startup wasn’t just a sprint — it was a series of deep digs, measured benchmarks, and purposeful architectural decisions. From async navigation graph inflation and background prefetching, to smarter dependency injection and baseline profile coverage — each layer we peeled back revealed another hidden performance bottleneck waiting to be addressed.
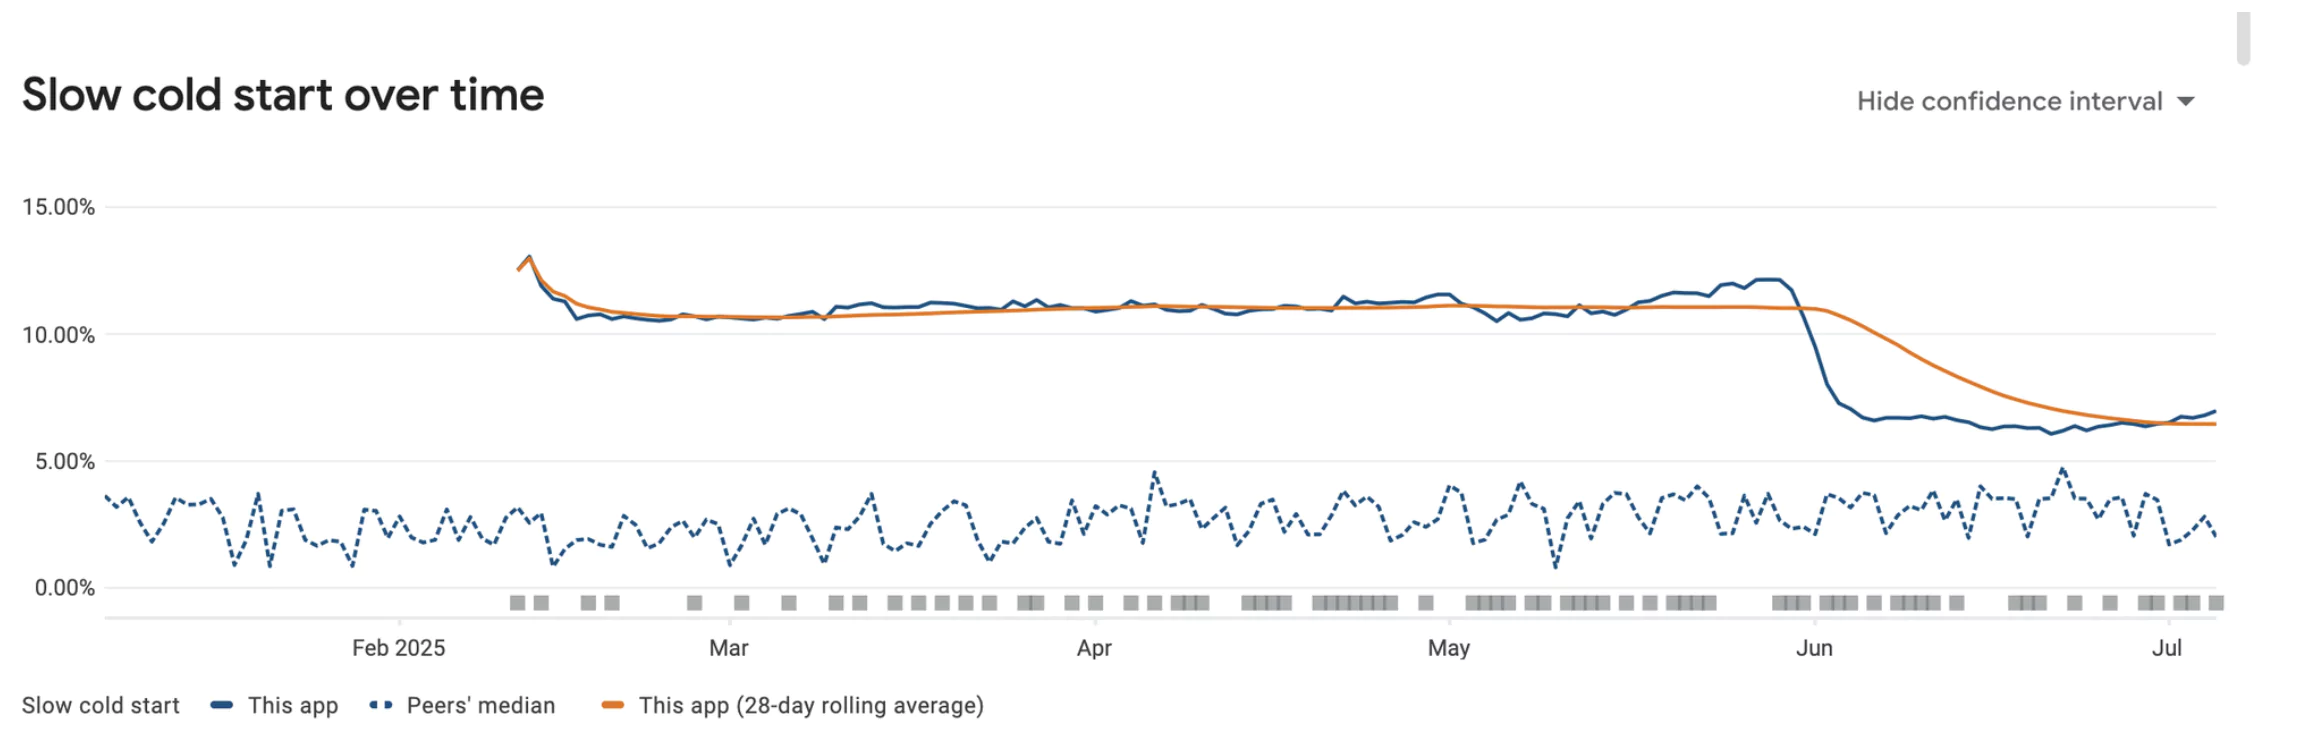
The impact? Android Vitals now reports a ColdStartupTime drop of over 40%, and our first-frame render time has significantly improved on devices across all tiers — from flagship to entry-level Cortex-A51 processors. Even users on older hardware are now experiencing a noticeably smoother launch experience — often before the splash screen finishes fading.
.png)
But perhaps the most satisfying part is this: these weren’t isolated hacks or one-off tweaks. This was a structured dig into our architecture, and what we uncovered wasn’t just quick wins — it was a gold mine of scalable, reusable insights that now power every release we ship.
We're still digging. But what we’ve already unearthed? That’s yours to use too.
And none of this would've been possible without the brilliant miners behind the scenes — [Kunal Gupta, Shashank Shetty and Soumen Paul] — who kept their pickaxes sharp and their eyes on performance gold.
🚀 Here’s to your next 40% gain. There’s gold under that jank. You just need the right tools. Until we meet next time keep your JAR's piggy bank sound with GOLD!